Island Biogeography
Islands usually have unique and interesting flora and fauna (but not Merryweather), like the giant tortoises of the Galapagos and the Komodo dragons of Komodo. They tend to have a lot of endemic species, which makes sense if we consider that islands are isolated so anything that evolves on an island probably doesn't occur elsewhere, unless it disperses off the island.
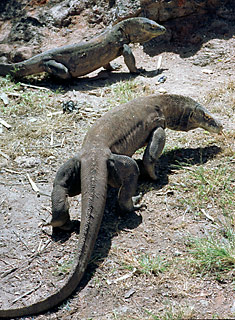
Komodo dragons.
Islands are interesting from a biogeography standpoint because anything that lives on an island had to get there from somewhere else, or evolve from something that came from somewhere else. Everything living on islands has relatives in other places. Lucky relatives, having a nice vacation connection like that.
We can also think about islands in a broader context than just oceanic islands. There are other types of islands too. Mountain peaks can be islands in a sense, because they offer a specific alpine habitat at the top but are surrounded by lower elevation land. Species that are adapted to life at the top might not be able to survive in the surrounding lowlands. When this happens, the mountain peaks are called "sky islands." Earth is an island, Mars is an island, and all other planets are islands, whether or not they have beaches and palm trees.
Two scientists, Robert MacArthur and E. O. Wilson, developed a theory to describe island biodiversity. Their theory is called the island equilibrium model. The island equilibrium model describes the number of species on an island based on the immigration and extinction rates of species on that island. Species have to get to the island from somewhere else, which is the immigration part, and species go extinct from the island as they run out of resources.
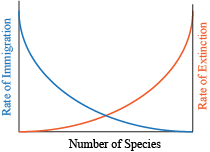
To understand their theory, take a look at the graph above. The axis on the bottom of the graph is the number of species. If we follow the blue line, it shows that as the number of species increases, the rate of immigration begins to decrease. That's because as more and more species arrive, the chances grow that that species is already present.
Consider this…if you went to Mars with your dog and cat, Mars would go from a population of zero species to a population of three species. If your cousin came next, maybe she'd bring her cat and a goldfish. So now, when you include the goldfish, Mars has four different species on it. Going from zero to three species is a much bigger leap than going from three to four is.
Another factor to consider as a new place is colonized is that the rate of extinction increases. That's because (1) there's just more things to go extinct and (2) there's more competition. You can see this illustrated in the orange line of the graph.
The idea of this model is that the number of species will settle around where these two lines meet. Once the island (or Mars) has a certain number of species, it stabilizes in this middle zone.
This model predicts that ALL places have the same number of species, right? WRONG. Since each island, continent, planet, or refrigerator (you really might want to clean that thing out…) has different rates of immigration and rates of extinction, these lines cross in different places.
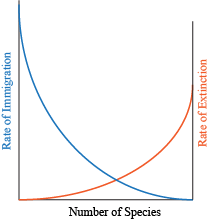
In MacArthur and Wilson's model, two things affect immigration and extinction rates. The first is how close the island is to the mainland (or Earth, if we are talking about Mars). The "mainland" is just the source of new immigrants to the island. Assuming all new species have to immigrate to the island from the mainland, closer islands will have more species on them than far islands, just because closer islands are easier to reach. Extinction is lower on islands close to the mainland because of the likelihood of immigration. There is more of a chance that new immigrants will arrive and keep a species in existence on that island. The graph below shows how an island closer to the mainland would have higher immigration rates, and therefore maintain a higher number of species. The taller the blue line is, the farther to the right the two lines cross.
The second thing that affects immigration and extinction rates is the size of the island. For immigration, think of the island as a target, for birds flying above or geckoes riding seagrass rafts on the water (it happens, really!). A bigger target is easier to hit than a small one, and a big island is more likely to have species land on it by chance than a small one is. Larger islands have more space than smaller islands, so there are likely to be more resources available for species to use. The opposite is true for smaller islands. Therefore extinction rates are larger on small islands. This can be seen in the graph below.
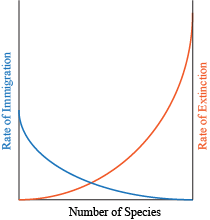
If we graph the rates of immigration and extinction, we can see the number of species on an island varies:
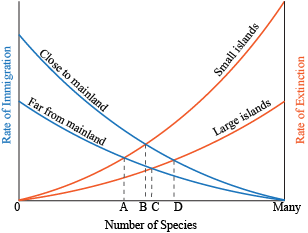
The equilibrium part of the island equilibrium model refers to the number of species. The island will reach equilibrium when extinction rates equal immigration rates. That is the A, B, C, and D in the graph above, which are different depending on size and distance.
The island equilibrium model is a great way to think about the things that influence species diversity on islands. However, it does not take into account everything that can happen. Disturbances such as hurricanes affect life on islands, and the model does not take into account evolution or interactions between species, such as competition.
Komodo dragons.
Islands are interesting from a biogeography standpoint because anything that lives on an island had to get there from somewhere else, or evolve from something that came from somewhere else. Everything living on islands has relatives in other places. Lucky relatives, having a nice vacation connection like that.
We can also think about islands in a broader context than just oceanic islands. There are other types of islands too. Mountain peaks can be islands in a sense, because they offer a specific alpine habitat at the top but are surrounded by lower elevation land. Species that are adapted to life at the top might not be able to survive in the surrounding lowlands. When this happens, the mountain peaks are called "sky islands." Earth is an island, Mars is an island, and all other planets are islands, whether or not they have beaches and palm trees.
Brain Snack
Sky islands have more mammals than anywhere else in the United States, and are where northern species ranges meet southern species ranges. Read or listen to a short newstory about them here.Two scientists, Robert MacArthur and E. O. Wilson, developed a theory to describe island biodiversity. Their theory is called the island equilibrium model. The island equilibrium model describes the number of species on an island based on the immigration and extinction rates of species on that island. Species have to get to the island from somewhere else, which is the immigration part, and species go extinct from the island as they run out of resources.
To understand their theory, take a look at the graph above. The axis on the bottom of the graph is the number of species. If we follow the blue line, it shows that as the number of species increases, the rate of immigration begins to decrease. That's because as more and more species arrive, the chances grow that that species is already present.
Consider this…if you went to Mars with your dog and cat, Mars would go from a population of zero species to a population of three species. If your cousin came next, maybe she'd bring her cat and a goldfish. So now, when you include the goldfish, Mars has four different species on it. Going from zero to three species is a much bigger leap than going from three to four is.
Another factor to consider as a new place is colonized is that the rate of extinction increases. That's because (1) there's just more things to go extinct and (2) there's more competition. You can see this illustrated in the orange line of the graph.
The idea of this model is that the number of species will settle around where these two lines meet. Once the island (or Mars) has a certain number of species, it stabilizes in this middle zone.
This model predicts that ALL places have the same number of species, right? WRONG. Since each island, continent, planet, or refrigerator (you really might want to clean that thing out…) has different rates of immigration and rates of extinction, these lines cross in different places.
In MacArthur and Wilson's model, two things affect immigration and extinction rates. The first is how close the island is to the mainland (or Earth, if we are talking about Mars). The "mainland" is just the source of new immigrants to the island. Assuming all new species have to immigrate to the island from the mainland, closer islands will have more species on them than far islands, just because closer islands are easier to reach. Extinction is lower on islands close to the mainland because of the likelihood of immigration. There is more of a chance that new immigrants will arrive and keep a species in existence on that island. The graph below shows how an island closer to the mainland would have higher immigration rates, and therefore maintain a higher number of species. The taller the blue line is, the farther to the right the two lines cross.
The second thing that affects immigration and extinction rates is the size of the island. For immigration, think of the island as a target, for birds flying above or geckoes riding seagrass rafts on the water (it happens, really!). A bigger target is easier to hit than a small one, and a big island is more likely to have species land on it by chance than a small one is. Larger islands have more space than smaller islands, so there are likely to be more resources available for species to use. The opposite is true for smaller islands. Therefore extinction rates are larger on small islands. This can be seen in the graph below.
If we graph the rates of immigration and extinction, we can see the number of species on an island varies:
The equilibrium part of the island equilibrium model refers to the number of species. The island will reach equilibrium when extinction rates equal immigration rates. That is the A, B, C, and D in the graph above, which are different depending on size and distance.
The island equilibrium model is a great way to think about the things that influence species diversity on islands. However, it does not take into account everything that can happen. Disturbances such as hurricanes affect life on islands, and the model does not take into account evolution or interactions between species, such as competition.