ShmoopTube
Where Monty Python meets your 10th grade teacher.
Search Thousands of Shmoop Videos
AP Statistics 2.3 Exploring Data 194 Views
Share It!
Description:
AP Statistics: Exploring Data Drill 2, Problem 3. Which set of points, if put in a scatterplot, would show us a positive correlation?
Transcript
- 00:00
Thank you We speak with this in your calculator and
- 00:05
shmoop which set of points if put in a scatter
- 00:08
plot would show us a positive correlation and hear the
- 00:11
potential answers Hearts waver and let's go All right It
- 00:15
wants us to find which set a point shows a
Full Transcript
- 00:17
positive correlation in other words as the independent variable increases
- 00:24
So does the dependent variable The best way to visualize
- 00:27
this thing is to one they could visual so let's
- 00:29
graphic the graph of the first set of data is
- 00:32
shown here and note that as thie x value of
- 00:35
the subsequent point increases so does the y values So
- 00:39
we know that there exists a positive correlation between these
- 00:42
three points will still look at the other sets of
- 00:44
points just to make sure that our answer is correct
- 00:46
Though graph of the second set of points has shown
- 00:49
here well we can see that this time the point
- 00:51
slope downward from the beginning and this is a negative
- 00:54
correlations the opposite of what we want next set is
- 00:57
shown here this time there's a slope of zero The
- 01:00
correlation is neither positive nor negative How about d again
- 01:04
this graph shows the horizontal correlation on lee this time
- 01:07
it's a larger wye valley which still doesn't make the
- 01:10
correlation posit Finally thiss graff has no correlation at all
- 01:14
the values move up and down without any pattern only
- 01:17
a has a positive correlation It looks like our answer's 00:01:19.999 --> [endTime] aye what
Up Next
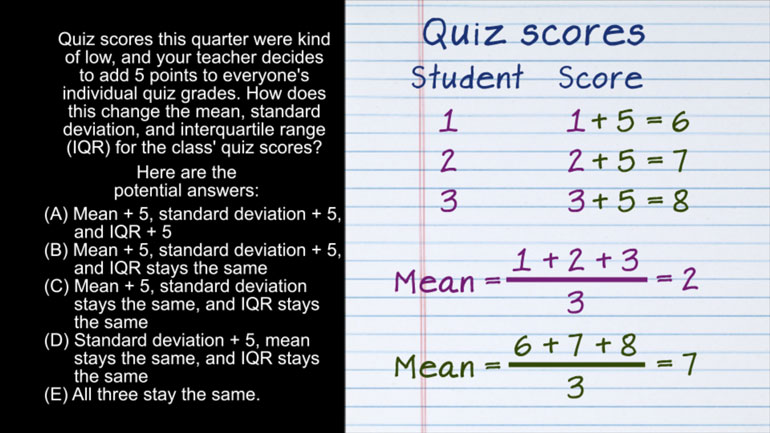
AP Statistics 2.1 Exploring Data. How does this change affect the mean, standard deviation, and IQR?
Related Videos
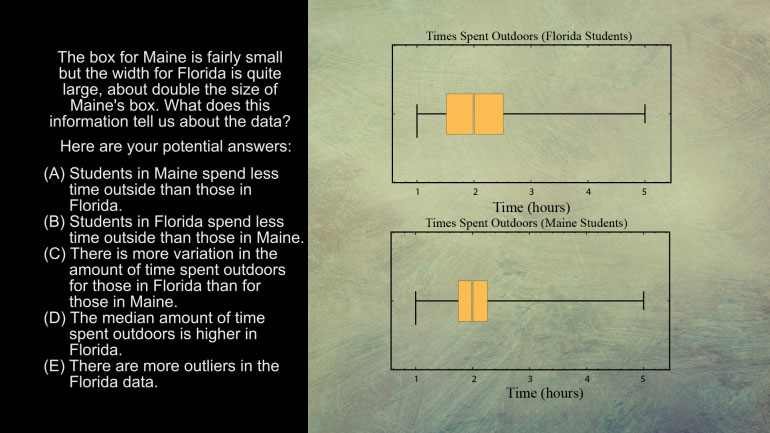
AP Statistics 5.1 Exploring Data. What does this information tell us about the data?
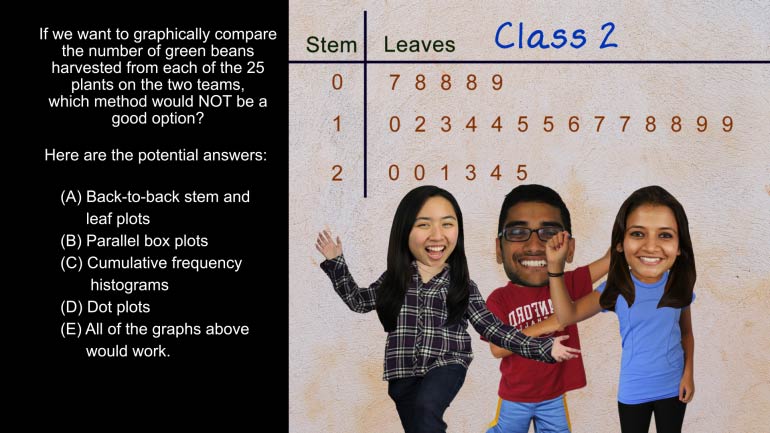
AP Statistics 5.2 Exploring Data. Which method would not be a good option?
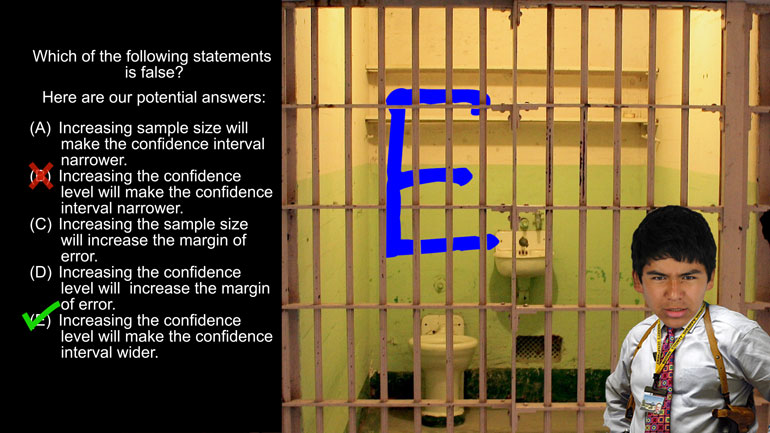
AP Statistics 1.5 Statistical Inference. Which of the following statements is false?

Want to pull an Oliver Twist and ask us for more? We've gotcha covered. Head over to /video/subjects/math/test-prep/ap-statistics/ for more AP...