We have changed our privacy policy. In addition, we use cookies on our website for various purposes. By continuing on our website, you consent to our use of cookies. You can learn about our practices by reading our privacy policy.

ShmoopTube

Where Monty Python meets your 10th grade teacher.

Search Thousands of Shmoop Videos

Statistics and Probability Videos


Play All
SAT Math 1.1 Statistics and Probability
289 Views

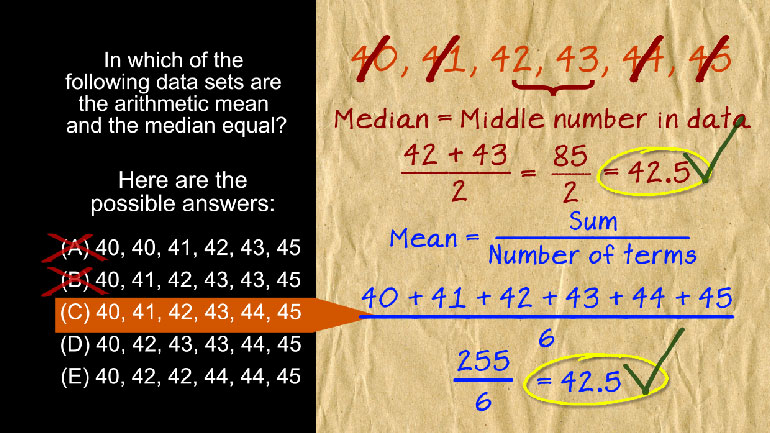
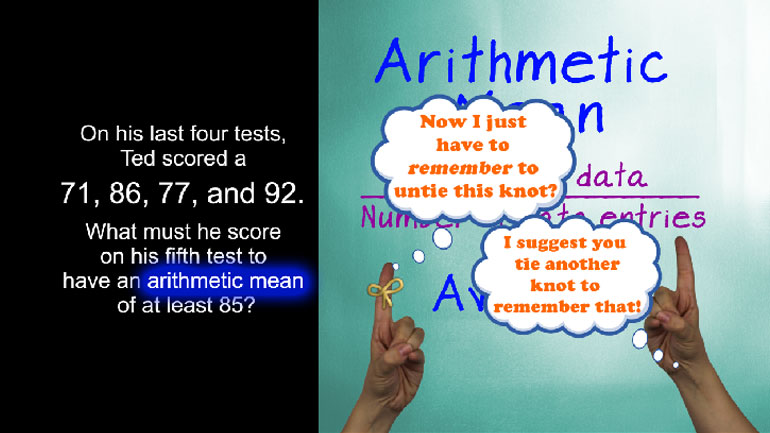
SAT Math 1.1 Statistics and Probability. In which of the following data sets are the arithmetic mean and the median equal?

SAT Math 1.2 Statistics and Probability
1060 Views

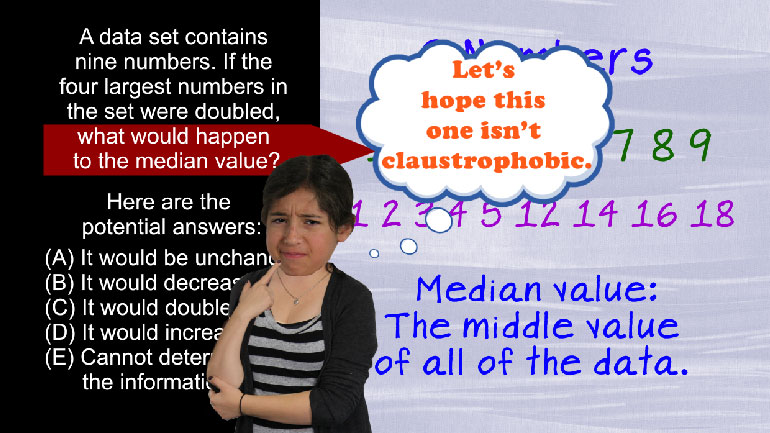
SAT Math: Statistics and Probability Drill 1, Problem 2. If the four largest numbers in the set were doubled, what would happen to the median...

SAT Math 1.3 Statistics and Probability
276 Views

SAT Math 1.3 Statistics and Probability. Approximately what is the probability that they will be placed in alphabetical order?

SAT Math 1.4 Statistics and Probability
380 Views

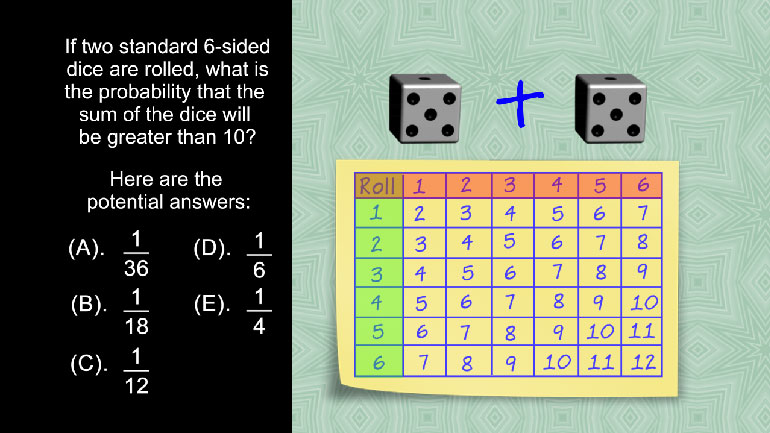
SAT Math 1.4 Statistics and Probability. If two standard 6-sided dice are rolled, what is the probability that the sum of the dice will be gre...

SAT Math 1.5 Statistics and Probability
359 Views

SAT Math 1.5 Statistics and Probability. If Silas draws one card, then places it in his pocket and draws another, what is the probability that...

SAT Math 2.1 Statistics and Probability
343 Views

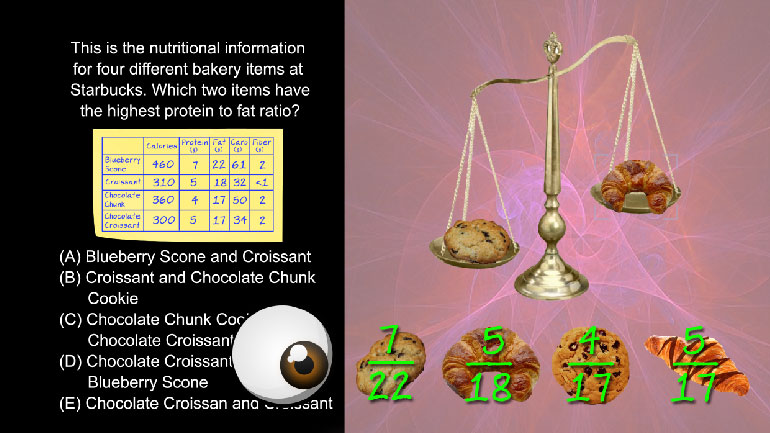
SAT Math 2.1 Statistics and Probability. Which two items have the highest protein to fat ratio?

SAT Math 2.2 Statistics and Probability
242 Views

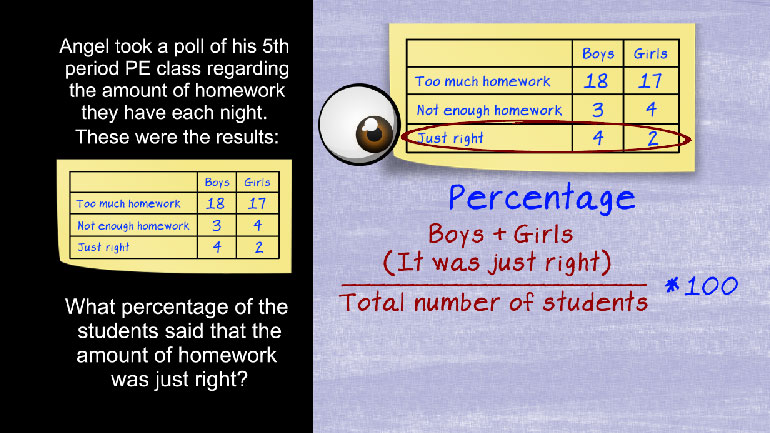
SAT Math 2.2 Statistics and Probability. What percent of her recommended daily intake of 2000 calories did she consume?

SAT Math 2.3 Statistics and Probability
229 Views

SAT Math 2.3 Statistics and Probability

SAT Math 2.4 Statistics and Probability
244 Views

SAT Math 2.4 Statistics and Probability

SAT Math 2.5 Statistics and Probability
241 Views

SAT Math 2.5 Statistics and Probability

SAT Math 3.1 Statistics and Probability
184 Views

SAT Math 3.1 Statistics and Probability

SAT Math 3.2 Statistics and Probability
195 Views

SAT Math 3.2 Statistics and Probability

SAT Math 3.3 Statistics and Probability
220 Views

SAT Math 3.3 Statistics and Probability

SAT Math 3.4 Statistics and Probability
269 Views

SAT Math 3.4 Statistics and Probability

SAT Math 3.5 Statistics and Probability
256 Views

SAT Math 3.5 Statistics and Probability

SAT Math 4.1 Statistics and Probability
243 Views

SAT Math 4.1 Statistics and Probability

SAT Math 4.2 Statistics and Probability
234 Views

SAT Math 4.2 Statistics and Probability

Using Conversion Factors to Solve for Density in Moles
9 Views

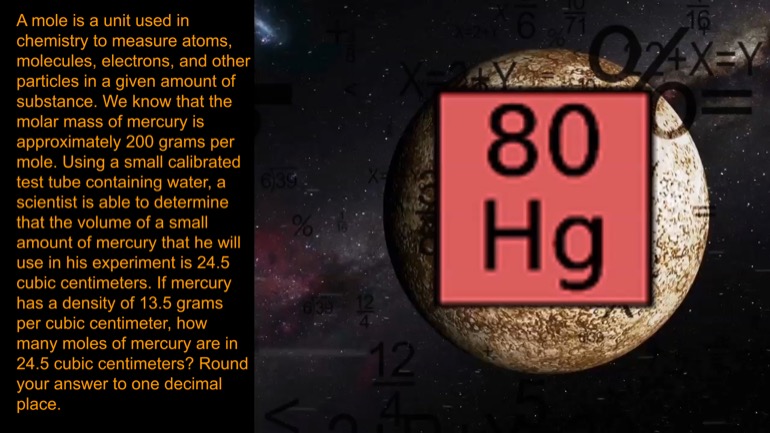
A mole is a unit used in chemistry to measure atoms, molecules, electrons, and other particles in a given amount of substance. We know that the mol...

SAT Math: Solving for an Unknown Variable Using Proportions
7 Views

Hydrostatic pressure is the force exerted by liquid upon an object. It is measured in pounds per square inch (psi) and increases proportionally wit...

SAT Math: Applying Conversions to Hot Air Balloon Heights
7 Views

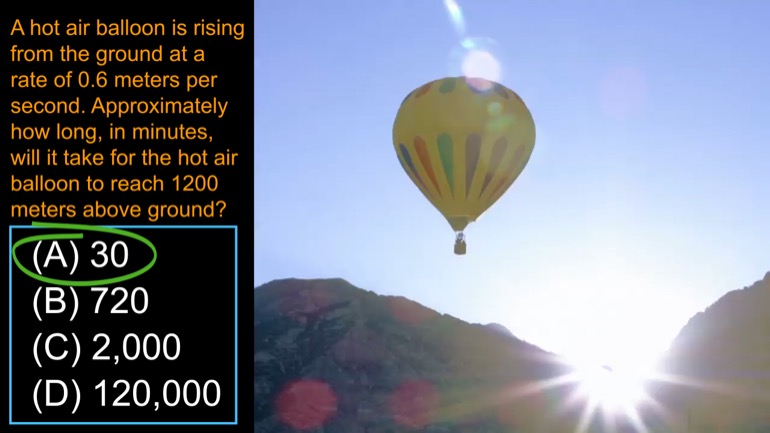
A hot air balloon is rising from the ground at a rate of 0.6 meters per second. Approximately how long, in minutes, will it take for the hot air ba...

SAT Math: Solving for the Length of Time It Takes Sea Levels to Rise
1 Views

A group of scientists ascertain that the global sea level has been rising 1.8 millimeters per year since 2005. If it continues to rise at a constant rate, approximately how many years would it take for the sea level to rise 25 millimeters?

SAT Math: Applying Metric Conversions to Solve for Building Height
1 Views

An architect has created a miniature model of a skyscraper he is proposing to build. The miniature model is built to scale, such that one inch represents 8 meters on the real building. If that scale model is 2 feet tall, how tall is the real building in meters?

SAT Math: Adding Percentages to Calculate Lost Volume
0 Views

In a chemistry experiment, Krystal will pour two different liquid substances into one container. In her first flask, she has 250 milliliters of liquid A. Krystal estimates that 5% of the liquid will be lost when transferring it to the container. In another flask, she has 900 milliliters of liquid B, and she estimates that 9% will be lost when transferring it. If she transfers both liquid A and B to the same container, what is the total volume of liquid in milliliters that will be lost in the transfer, assuming Krystal's estimates are accurate?

SAT Math: Using the Difference in the Area of Two Rectangles to Find the Percentage Increase in Width
2 Views

The area of rectangle B is 45% larger than the area of rectangle A. The length of rectangle B is 12% greater than that of rectangle A. The width of rectangle B is x% greater than that of rectangle A. What is x?

SAT Math: Which Expression Represents the Non-Discounted Price of a TV?
0 Views

The local electronics store is offering a 30% discount on all its discontinued TV models. However, a 7% sales tax will be applied to the price after the discount. If the total cost to purchase one of these TVs, including the discount and the tax, is d, then which of the following expressions can be used to determine the original price of the TV?

SAT Math: Solving for the Percentage of Body Weight an Athlete Lost
1 Views

An athlete's body weight drops by p% over the course of 2 years. If his initial body weight was 212 pounds, and his weight dropped to 178 pounds at the end of the two-year period, then which of the following values approximates p?

SAT Math: Using Substitution and Percentages to Solve for x
0 Views

x is 30% greater than y. If the sum of x and y is 500, then which of the following approximates the value of x?

SAT Math: Estimating the Equation for a Scatterplot Using a "Best Fit" Curve
10 Views

An equation using the real number constants c and d will be created to model the data given in the graph above. Given that c > 0 and d > 0, which of the following equations, in terms of c and d, most likely models the data in the scatterplot?

SAT Math: Making Predictions Using the Slope of a "Best Fit" Line
12 Views

The scatterplot above shows data indicating the annual profit from computer sales by a technology company in a given year. Researchers use a line of best fit to estimate the annual profit for years not shown in the graph above. Which of the following would these researchers estimate was the annual profit from computer sales for the year 2011?

SAT Math: Identifying the Correct Correlation from Scatterplot Options
1 Views

Which of the following scatterplots indicates a strong positive correlation between A and B?

SAT Math: Calculating the Slope of a "Best Fit" Line
3 Views

The scatterplot above depicts the annual population for a small town. By approximately how many people does the population increase per year?

SAT Math: Comparing Values on a "Best Fit" Line
9 Views

The scatterplot above shows the decline of the population of a species of endangered wolf. Using the line of best fit, find the difference between the predicted population and the actual population in 2001. Write your answer as a positive number and round to the nearest hundred.

SAT Math: Relating the y-intercept on a Graph to a Word Problem
0 Views

In order to borrow books from the local library, a membership fee must be paid. How many dollars is the membership fee?

SAT Math: Which Linear Function Matches the Given Graph?
10 Views

Which of the following equations best represents the relationship between the total cost, D, and the number of books, B?

SAT Math: Interpreting Distance Travelled by Minute from a Graph
3 Views

The graph above represents a jogger's route in a park starting at 10:00 a.m. The x-axis represents the number of minutes she jogged, and the y-axis represents her distance from the entrance of the park. At which of the following times was the jogger not moving?

SAT Math: Recognizing Differences in the Slope of a Line
0 Views

A toy company manufactures toy cars for children. The graph above shows the annual sales of those toy cars. During these five years, when did the yearly sales rate begin to decline?

SAT Math: Comparing Slopes Between Different Points on a Line
1 Views

The graph above shows approximate populations of England at different dates during the Industrial Revolution. According to the graph, what is the difference between the population growth between 1821 and 1831 and the population growth between 1811 and 1821?

SAT Math: Calculating Multiple Slopes to Predict Exponential Bacteria Growth
1 Views

A colony of bacteria initially contains 5 bacteria. After 10 minutes, there are 8 bacteria. After 25 minutes, there are 25 bacteria, and after 30 minutes, there are 38. Which of the following equations best models the number of bacteria, B, in the colony after t minutes?

SAT Math: Comparing Ratios from Given Data
3 Views

The equation above represents the surface area of the ocean, in square meters, covered by jellyfish x years after they've escaped from captivity. The result is influenced by a, the surface area covered by the jellyfish that took part in the initial breakout. If 27 m2 of jellyfish escaped from Glows-R-Us Labs five years ago, while 61 m2 of jellyfish escaped from Frankenstein's Pet Shop two years ago, what is the ratio of the current surface area of the Glow jellyfish to that of the Frankenjellies?

SAT Math: Plugging in Data from Word Problems to Find the Difference in Equations
0 Views

A businessman invests $3000 in Company A. The revenue he earns from this investment can be modeled by 3000(1.1)t where t is the number of years that have passed since his initial investment. At the same time that this businessman invests in Company A, his neighbor, a salesman, starts to make money by selling microchips. The salesman estimates the revenue from his business can be modeled by 700t, where t is the number of years that have passed since he started selling microchips. After 10 years, what is the difference in revenue for these particular business dealings between the two neighbors? Round your answer to two decimal places.

Load More Videos