ShmoopTube
Where Monty Python meets your 10th grade teacher.
Search Thousands of Shmoop Videos
Scatterplots Videos 9 videos


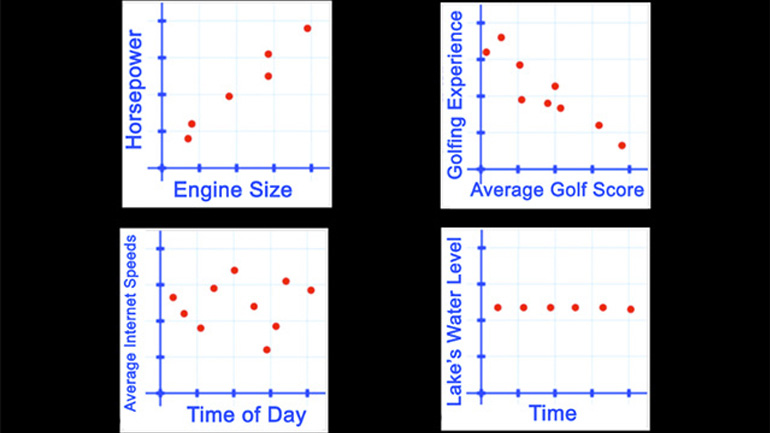
Statistics, Data, and Probability II Drill 4 Problem 1. Which of the following scatter plots represents a negative correlation between the data sets?
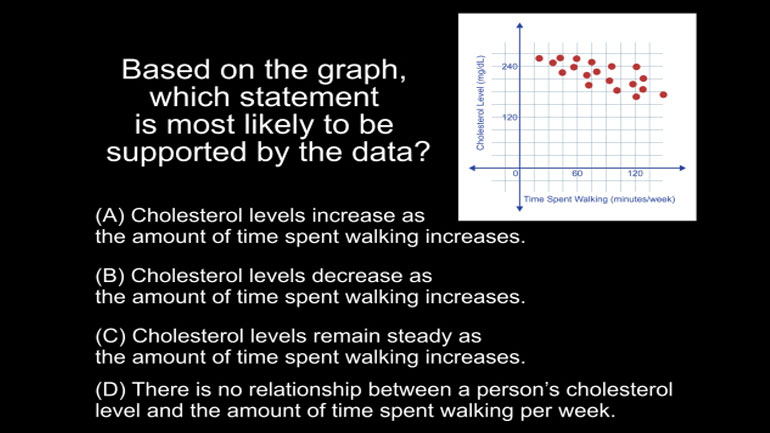
Statistics, Data, and Probability II Drill 4 Problem 2. Based on the graph, which statement is most likely to be supported by the data?
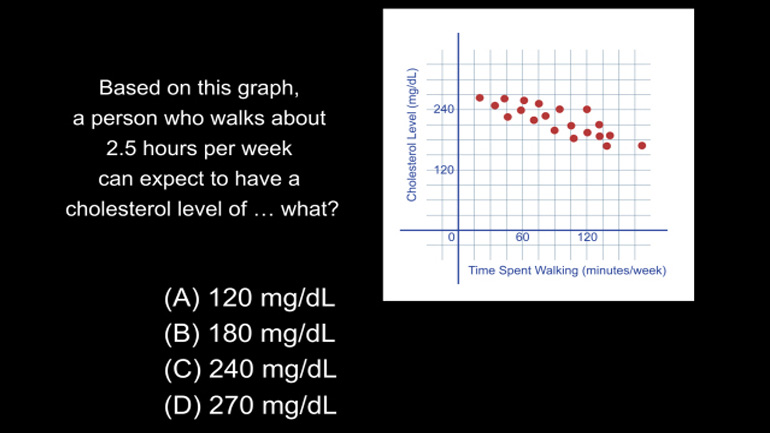
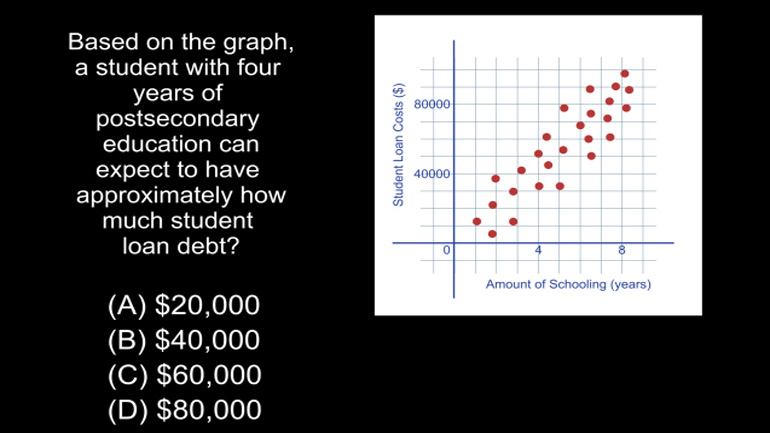
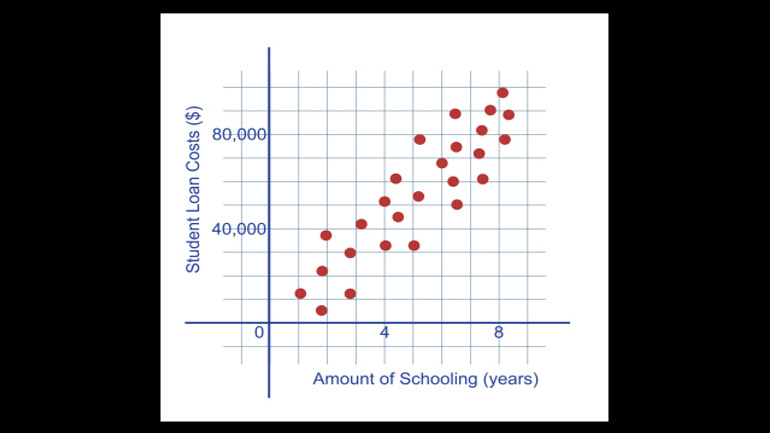
Statistics, Data, and Probability II Drill 4 Problem 3. Based on this graph, a person who walks about 2.5 hours per week can expect to have a...
CAHSEE Math 4.1 Statistics, Data, and Probability II 226 Views
Share It!
Description:
Statistics, Data, and Probability II Drill 4 Problem 1. Which of the following scatter plots represents a negative correlation between the data sets?
Transcript
- 00:03
Here's your shmoop du jour.
- 00:05
Which of the following scatter plots represent a negative correlation between the data sets?
- 00:12
And here are the potential answers...
- 00:17
Whoa. Negative corre-what?
- 00:20
Ok, five dollar word alert. A correlation occurs when something is similar to something else.
Full Transcript
- 00:26
Like… there’s a correlation between the TV viewing audience of Honey Boo Boo…
- 00:30
…and the number of antidepressants sold daily in the US.
- 00:35
So when a correlation is NEGATIVE it’s basically just saying that they’re NOT like each other.
- 00:40
In plot A, we can see that as engine size increases…
- 00:44
…horsepower also increases… so the two are POSITIVELY correlated with one another.
- 00:50
B is just the opposite… and THAT’s the one we’re looking for.
- 00:53
As golfing experience increases, golf scores go down.
- 00:59
So our answer is B.
- 01:01
As in, “Bogey.”
Related Videos

CAHSEE Math: Algebra and Functions Drill 5, Problem 3. Solve the equation.
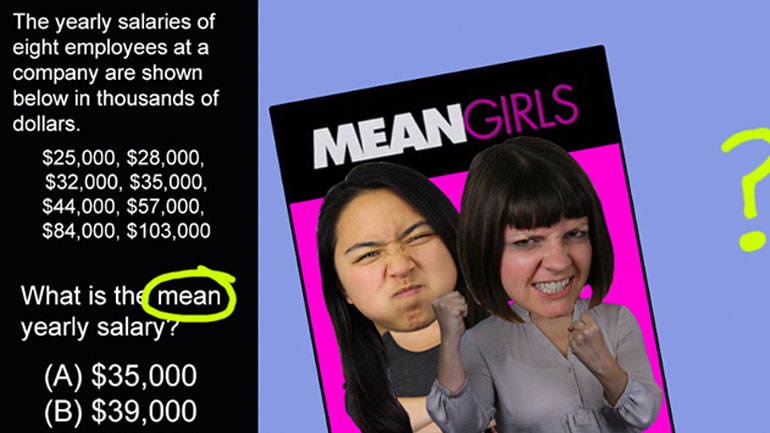
Statistics, Data, and Probability I: Drill Set 1, Problem 1. What is the mean yearly salary?

Statistics, Data, and Probability I: Drill Set 1, Problem 2. What is the median length of these writing utensils?
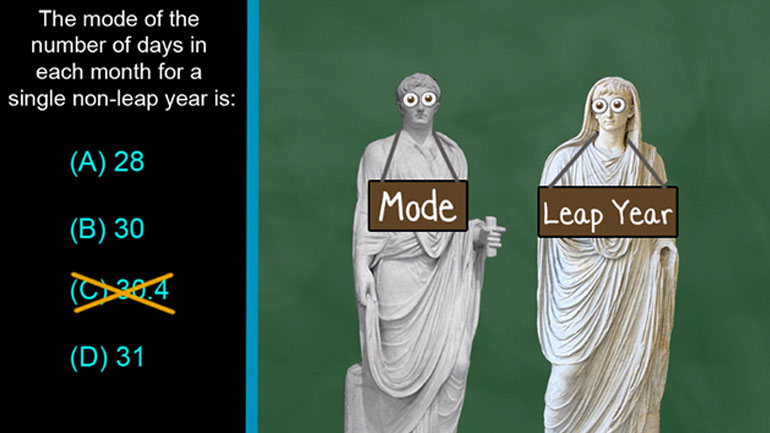
CAHSEE Math Statistics, Data, and Probability I: Drill Set 1, Problem 3. The mode of the number of days in each month for a single non-leap year is...
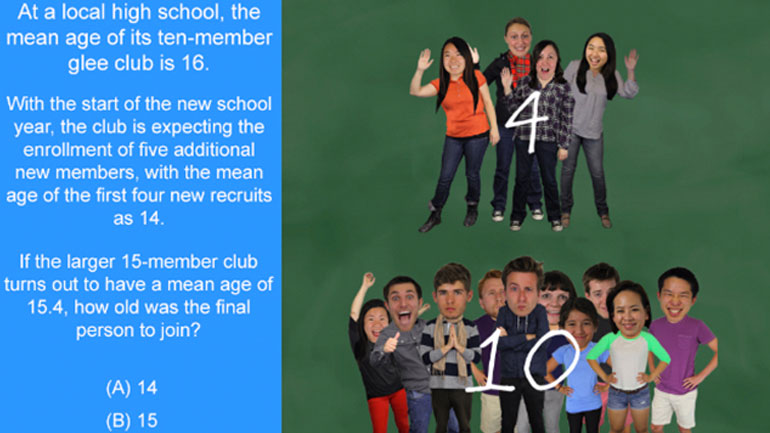
Statistics, Data, and Probability I: Drill Set 1, Problem 4. How old was the final person to join?