ShmoopTube
Where Monty Python meets your 10th grade teacher.
Search Thousands of Shmoop Videos
Statistical Measures Videos
Play All
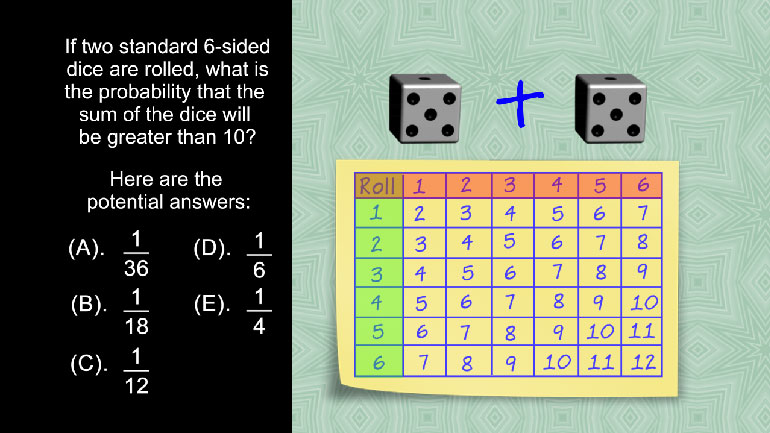
SAT Math 1.4 Statistics and Probability. If two standard 6-sided dice are rolled, what is the probability that the sum of the dice will be gre...
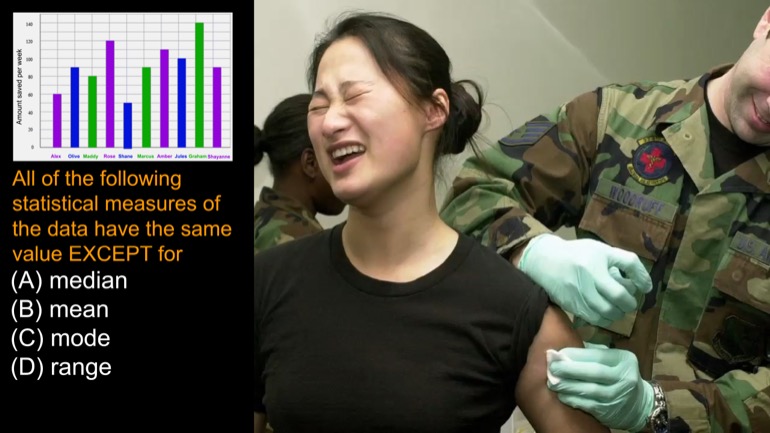
All of the following statistical measures of the data above have the same value EXCEPT for
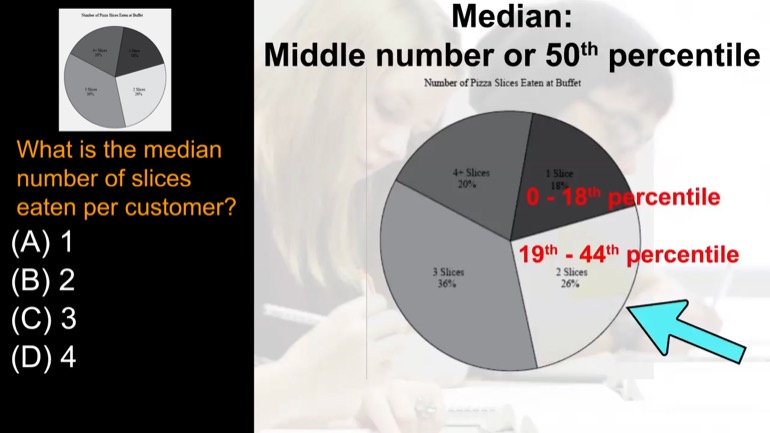
What is the median number of slices eaten per customer?
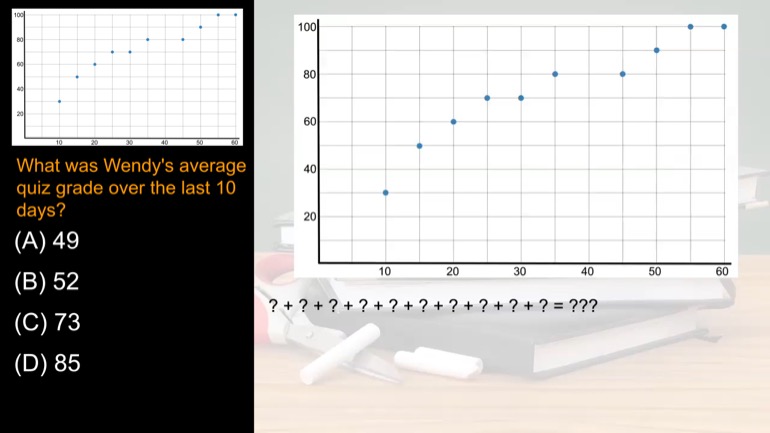
What was Wendy's average quiz grade over the last 10 days?
What is the range of the dataset {9, 5, 27, 11, 15, 4, 18}?
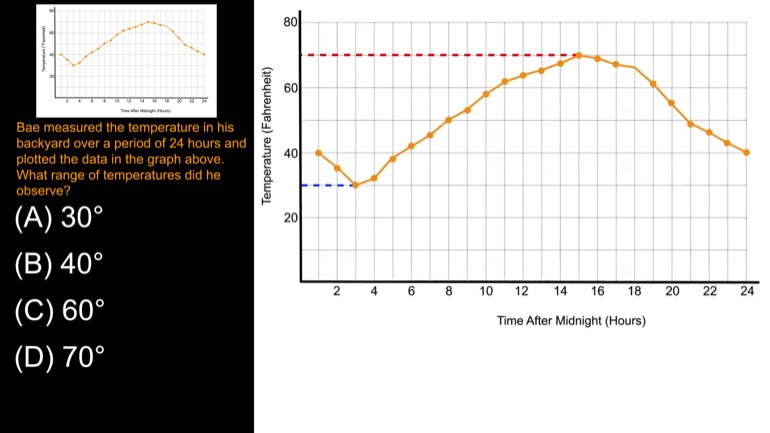
Bae measured the temperature in his backyard over a period of 24 hours and plotted the data in the graph above. What range of temperatures did he o...
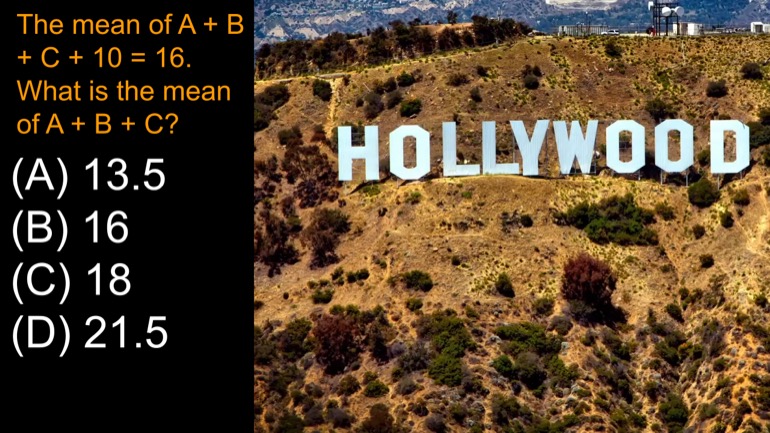
The mean of a, b, c, and 10 is 16. What is the mean of a, b, and c?
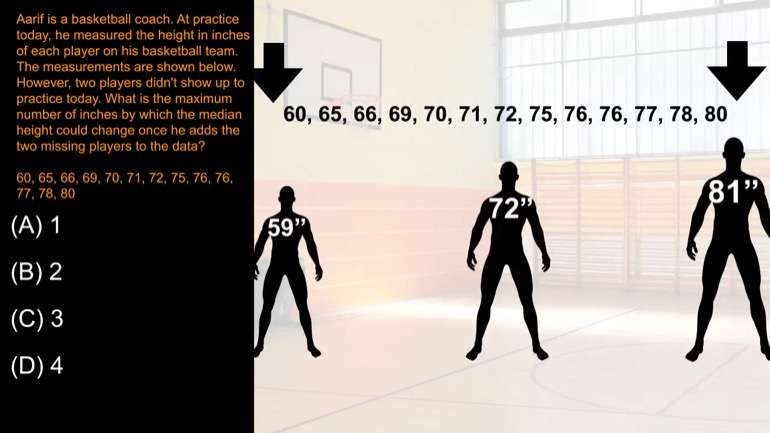
Aarif is a basketball coach. At practice today, he measured the height in inches of each player on his basketball team. The measurements are shown...
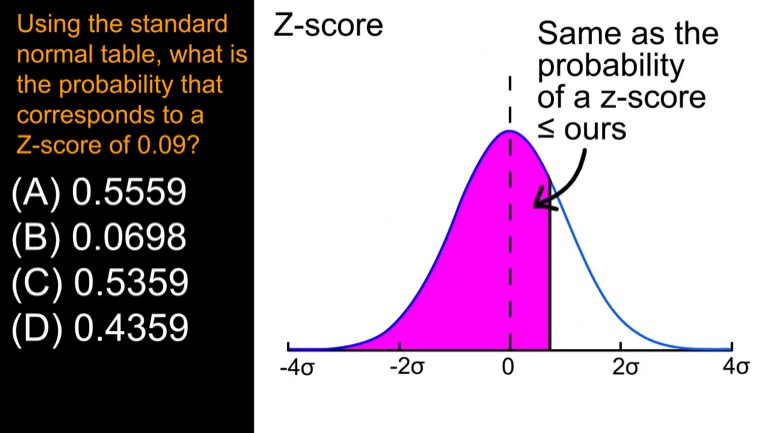
Using this standard normal table, what is the probability that corresponds to a Z-score of 0.09?
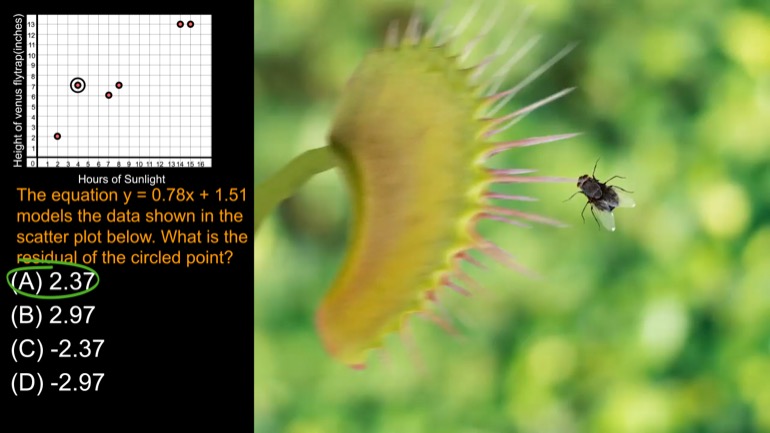
The equation y = 0.78x + 1.51 models the data shown in the scatter plot below. What is the residual of the circled point?
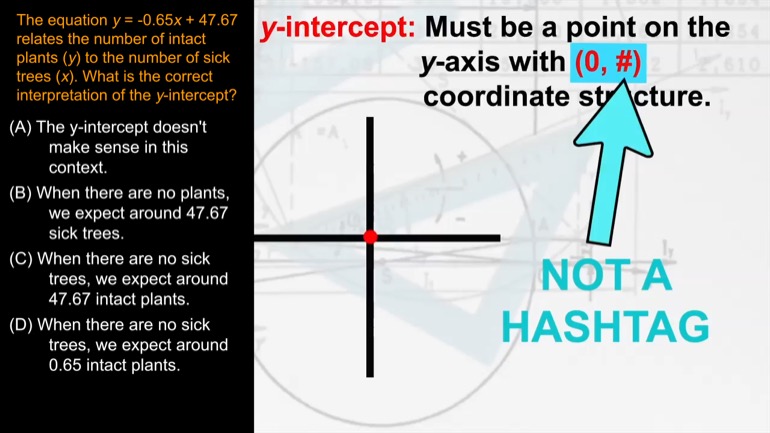
The equation y = -0.65x + 47.67 relates the number of intact plants (y) to the number of sick trees (x). What is the correct interpretation of the...
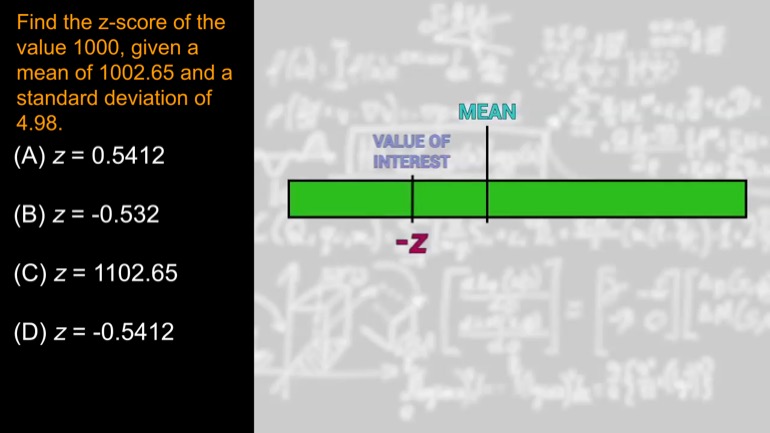
Find the z-score of the value 1000, given a mean of 1002.65 and a standard deviation of 4.98.

Histograms are a neat way to organize massive amounts of related data for easy comparison and reference. If only history were this tidy.