ShmoopTube
Where Monty Python meets your 10th grade teacher.
Search Thousands of Shmoop Videos
Statistical Measures Videos 15 videos
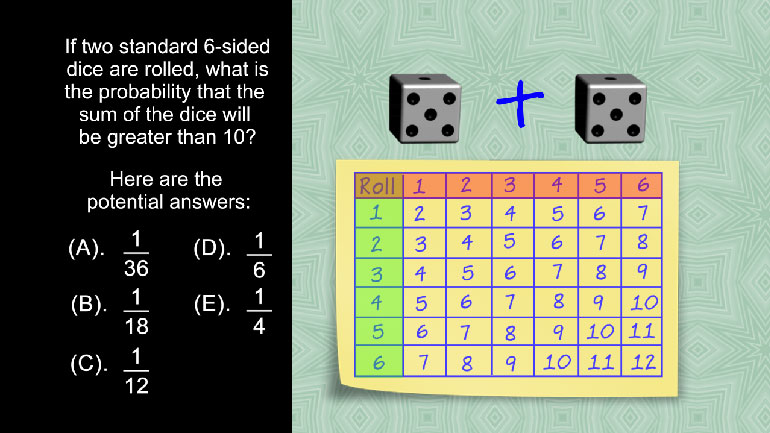
SAT Math 1.4 Statistics and Probability. If two standard 6-sided dice are rolled, what is the probability that the sum of the dice will be gre...

TSI Math: Identifying the Range on a Graph 34 Views
Share It!
Description:
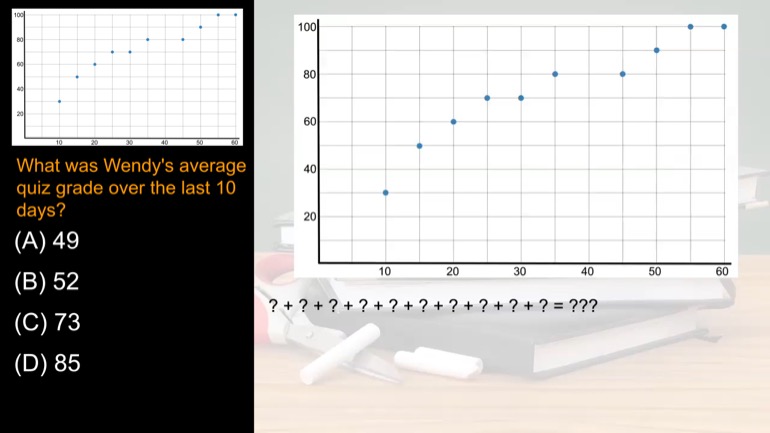
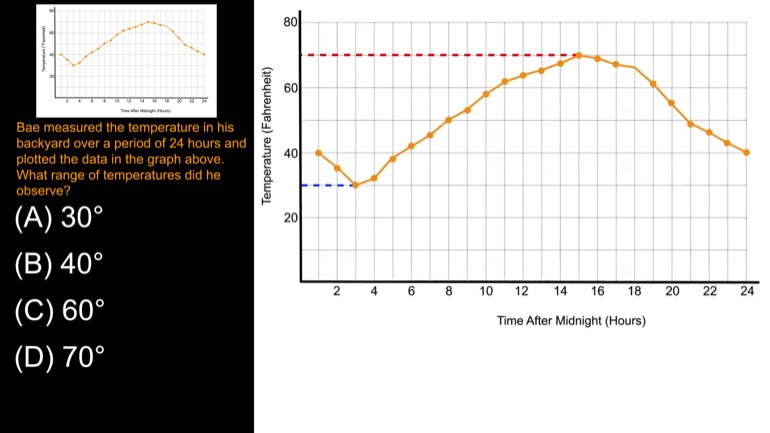
Bae measured the temperature in his backyard over a period of 24 hours and plotted the data in the graph above. What range of temperatures did he observe?
- Data Analysis, Statistics, and Probability / Statistical Measures
- TSI Math / Data Analysis, Statistics, and Probability
- Test Prep / TSI
- TSI Mathematics / Data Analysis, Statistics, and Probability
- TSI / TSI Math
- Data Analysis, Statistics, and Probability / Statistical Measures
- TSI / TSI Mathematics
- Test Prep / TSI
Transcript
- 00:02
Okay sy mash members We got a whole section here
- 00:04
on stats probability and reasoning Okay well bay measured the
- 00:08
temperature in his backyard over a period of twenty four
- 00:11
hours and plotted the data in the graph above What
- 00:14
range of temperatures did he observed All right these air
Full Transcript
- 00:21
in fahrenheit or american andi let's say time after midnight
- 00:26
and see khun tell here it got a lot warmer
- 00:28
during the day and then colder at night Well let's
- 00:31
see the range of a set of data is the
- 00:32
difference between the highest and lowest values right Well the
- 00:35
graph shows us that the highest temperature right there that
- 00:38
they observed was seventy degrees and lowest temperature he observed
- 00:41
was thirty while the range then in seventy minus thirty
- 00:44
or forty degrees that's it The answer is b we're
- 00:47
shmoop
Related Videos
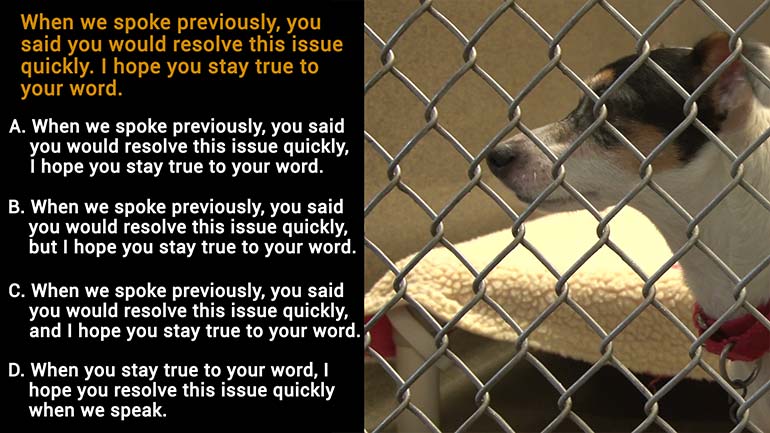
Which is the best way to revise and combine sentences 1 and 2?
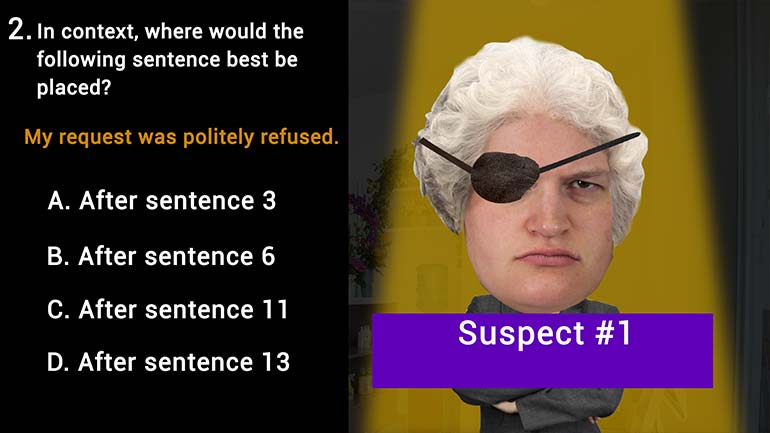
Where would the following sentence best be placed?
Which of the following is best to insert at the beginning of sentence 8?
Which is the best location for sentence 9?
Which of the following sentences is best to insert between sentences 11 and 12?