ShmoopTube
Where Monty Python meets your 10th grade teacher.
Search Thousands of Shmoop Videos
Trigonometry Videos 27 videos
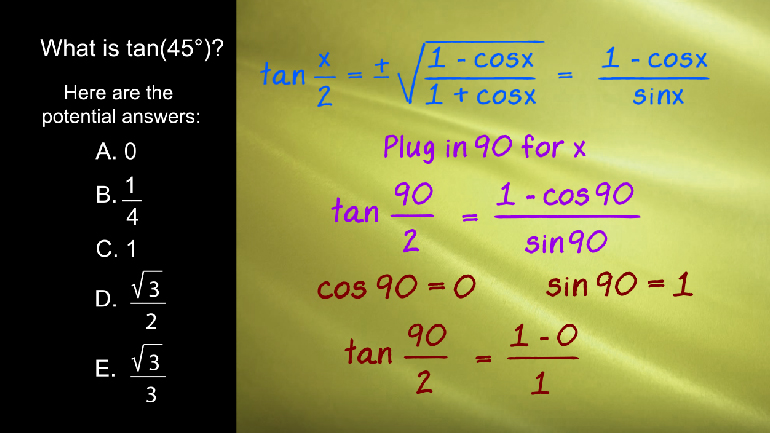
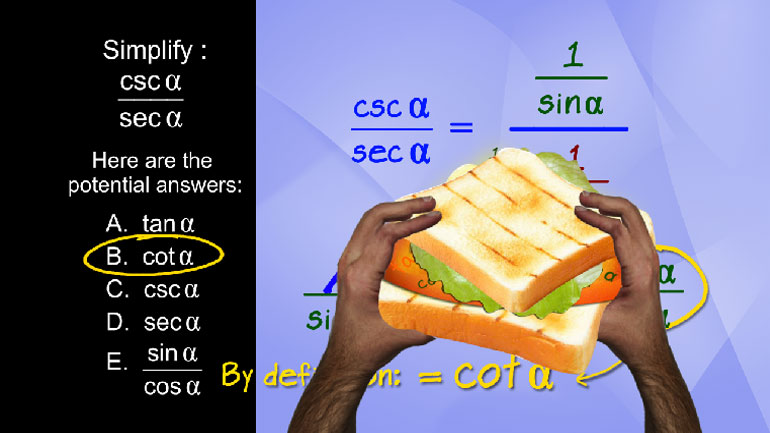
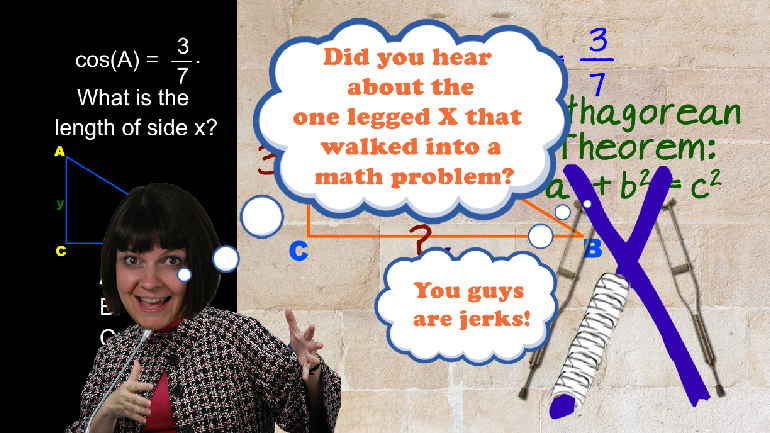
ACT Math Trigonometry Drill 1, Problem 2. Can you find the tangent?
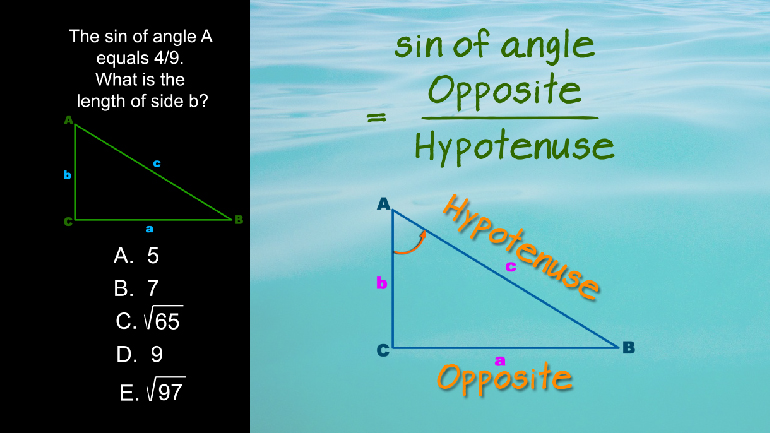
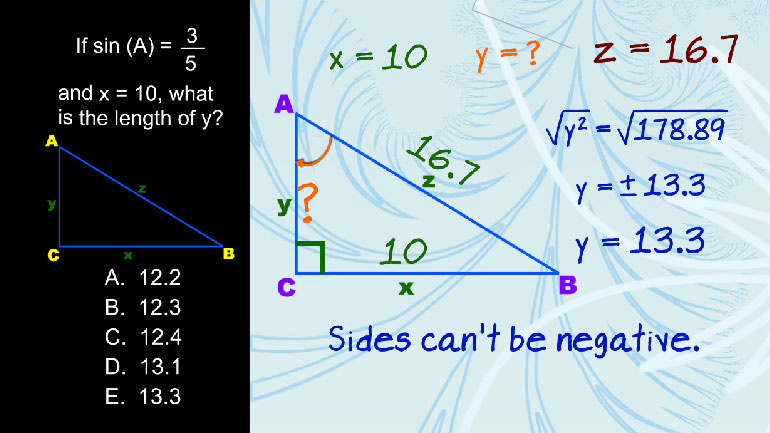
ACT Math: Trigonometry Drill 4, Problem 3. What is the length of side b?
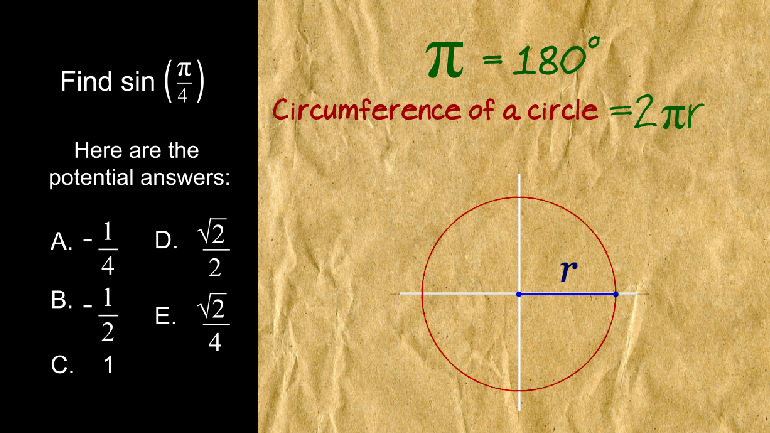
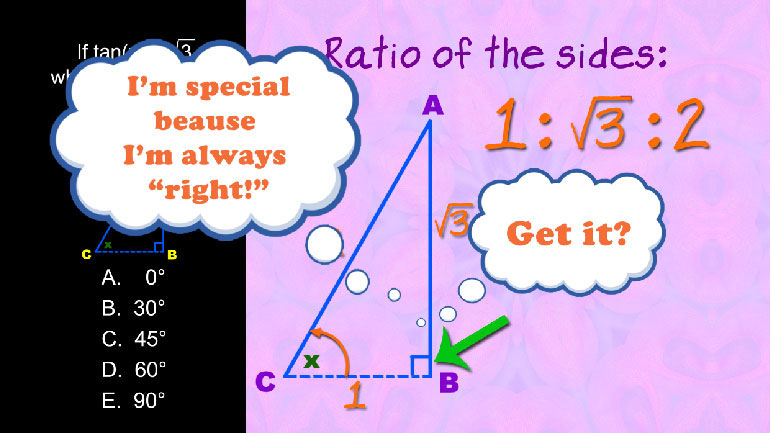
ACT Math: Trigonometry Drill 1, Problem 4. Can you find the sine?
ACT Math 2.3 Trigonometry 238 Views
Share It!
Description:
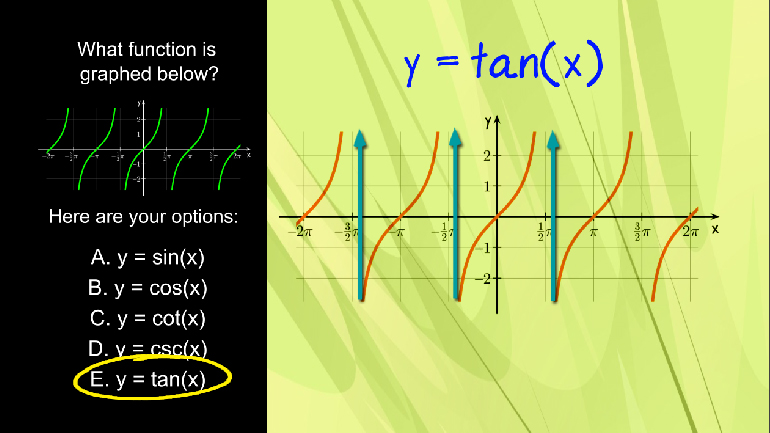
ACT Math: Trigonometry Drill 2, Problem 3. The graph shown represents which function?
- Trigonometry / Trig graphs
- Product Type / ACT Math
- Foreign Language / Arabic Subtitled
- Foreign Language / Korean Subtitled
- Foreign Language / Spanish Subtitled
- Foreign Language / Chinese Subtitled
- Functions / Model periodic phenomena with trigonometric functions
- Functions / Model periodic phenomena with trigonometric functions
- Trigonometry / Graphing trigonometric functions
Transcript
- 00:02
And here is your shmoop du jour...
- 00:03
The following is a graph above which function?
- 00:06
Here are the answers...
- 00:10
Sine. Cosine. Cactus. Cot. What ever that is. The figure starts at
- 00:15
0 ends at 2 pi, so it's period
Full Transcript
- 00:18
is 2pi...thats this thing. It goes all the way up
- 00:22
one and goes all the way down to -1 so it's
- 00:26
amplitude is 1. The options that immediately come to mind based on these
- 00:30
details are
- 00:31
A and B. Sine and Cosine. The difference though is that a normal sign graph
- 00:37
begins at the origin
- 00:38
whereas a normal cosine graph begins at point zero one.
- 00:43
This one looks like it's the latter...so our answer is A.
Related Videos
ACT Math: Coordinate Geometry Drill 1, Problem 1. Which inequality is expressed by the number line?
ACT Math: Intermediate Algebra: Drill 3, Problem 1. Find the fifth number in the series.
ACT Math: Plane Geometry Drill 3, Problem 1. What is the area of the trapezoid shape in the video?
Haven't you always wondered how much cardboard it takes to encase a trunk warmer for your pet elephant?
Want to figure out the area and perimeter of irregular shapes? Break them down into regular shapes. For example, a flower can be broken down into s...
