ShmoopTube
Where Monty Python meets your 10th grade teacher.
Search Thousands of Shmoop Videos
Data Representation Passage Videos 25 videos


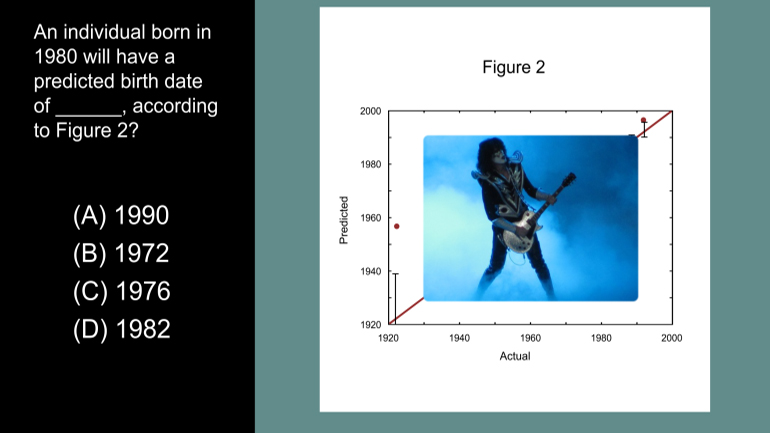
ACT Science Data Representation Passage: Drill 3, Problem 5. According to Figure 2, what birth date will be predicted for an individual actual...

ACT Science: Data Representation Passage Drill 1, Problem 2. Which of the following is a variable in Figure 1, but not in Figure 2?

ACT Science: Data Representation Passage Drill 1, Problem 1. What do the statistics in Figure 1 suggest?
ACT Science 2.1 Data Representation Passage 229 Views
Share It!
Description:
ACT Science: Data Representation Passage Drill 2, Problem 1. What does each of the dots on the first two graphs in Figure 1 represent?
Transcript
- 00:03
Here's your shmoop du jour, brought to you by the Axis of Evi-... uh the Axis of Shmoop. Not evil at all.
- 00:27
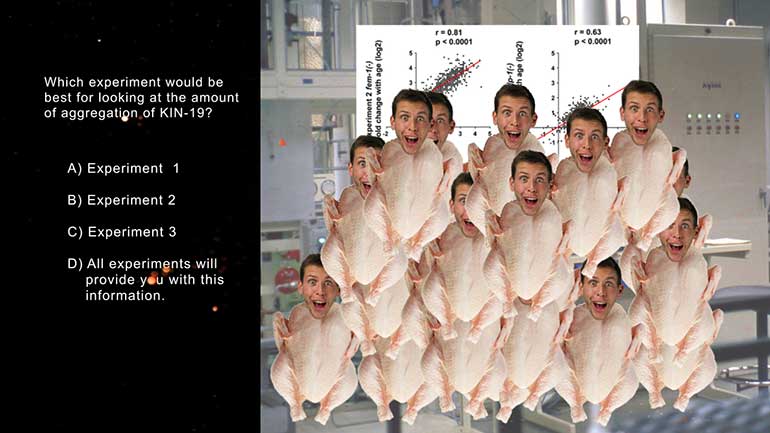
Each of the dots on the first two graphs in Figure 1
- 00:29
(generated from Experiments 1 and 2) represents:
- 00:33
And here are the potential answers...
- 00:40
This question is asking us about what the
Full Transcript
- 00:41
dots in Figure 1 represents...
- 00:44
...so let's take a closer look at Figure 1.
- 00:46
We can figure out what each dot represents by looking at the axes of the graph.
- 00:50
This is an "understand the axis" question. What good will it do now to understand
- 00:54
Nazi Germany, Fascist Italy, and Imperial Japan?
- 00:57
The axis on the graph.
- 00:58
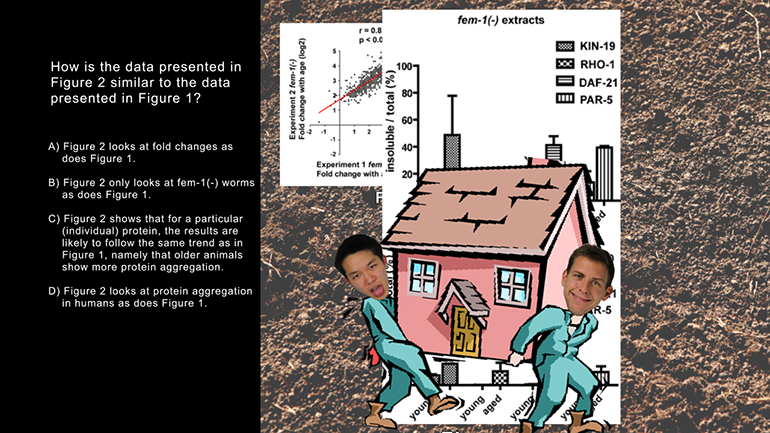
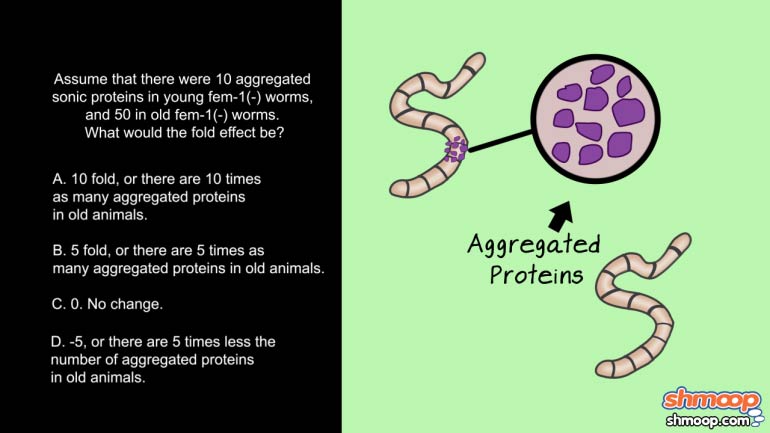
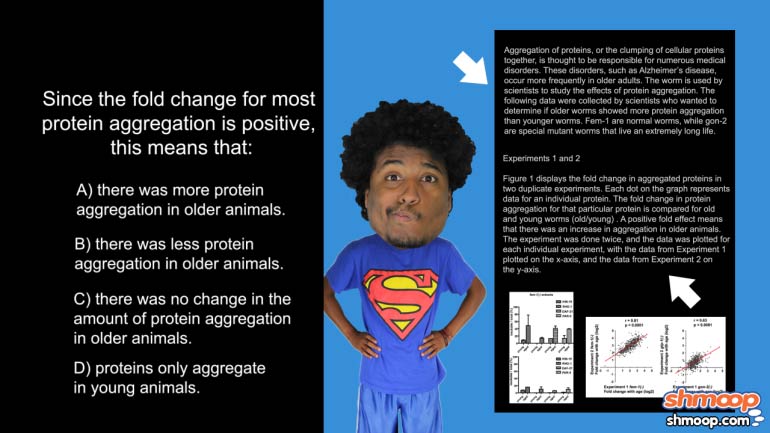
The dots are defined in the text for Experiments 1 and 2: each dot on the graph represents
- 01:02
data for an individual protein. The fold change in protein aggregation for that protein is
- 01:08
compared for old and young worms.
- 01:10
The data from Experiment 1 is plotted on the x-axis,
- 01:13
and the data from Experiment 2 is plotted on the y-axis.
- 01:17
This looks like it's an easy one. Choice A! That's it. We're done.
Related Videos
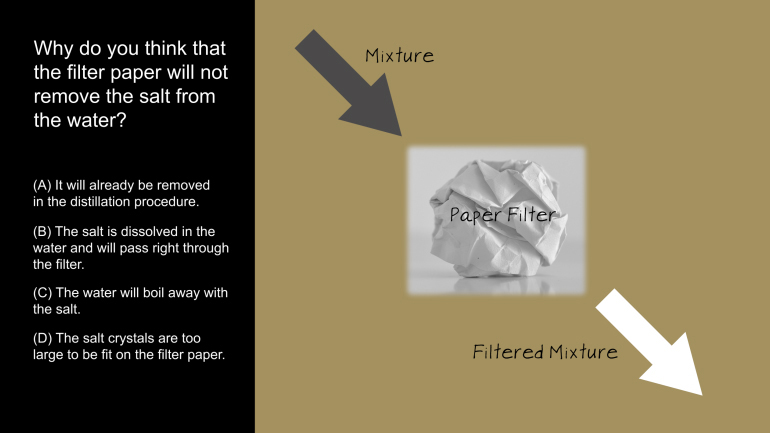
ACT Science: Research Summary Passage Drill 2, Problem 1. Why do you think that the filter paper will not remove the salt from the water?
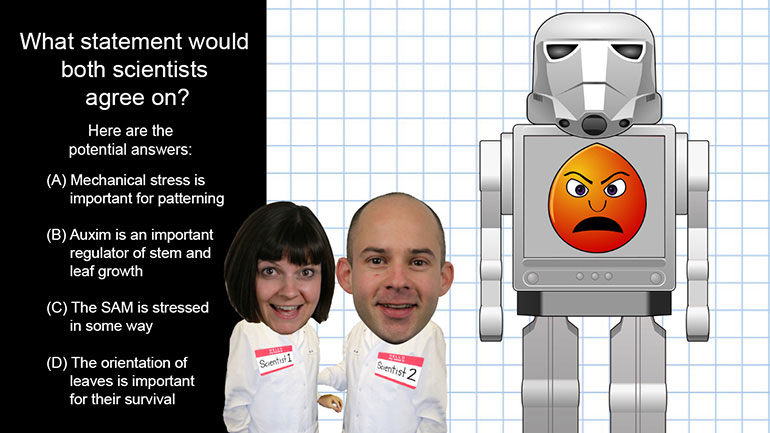
ACT Science: Conflicting Viewpoint Passage Drill 1, Problem 1. What statement would both scientists agree upon?
ACT Science: Data Representation Passage Drill 1, Problem 1. What do the statistics in Figure 1 suggest?
ACT Science: Data Representation Passage Drill 1, Problem 2. Which of the following is a variable in Figure 1, but not in Figure 2?
ACT Science Data Representation Passage: Drill 3, Problem 5. According to Figure 2, what birth date will be predicted for an individual actual...