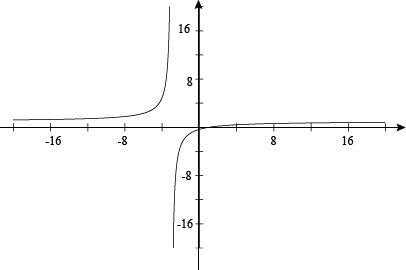
The degrees of the two polynomials are both 2, so we have a horizontal asymptote. The ratio of the leading coefficients is 1:1, so the asymptote is at the line y = 1. To find any vertical asymptotes, we need to factor and simplify everything. 
The discontinuity that remains, at x = -3, is a vertical asymptote, while the one that disappeared, x = 1, is a hole. Next on the agenda is finding the intercepts. For y we have: 
x is next: x2 – 1 = 0 x = -1 and 1 Woop, woop, woop, warning! We already have a hole at x = 1, so disregard that as an intercept. All of our points so far are to the right of the vertical asymptote. The other side is completely uncharted territory. How about we send some scouts to x = -4 and -5 to get an idea of what it looks like? 

We have the asymptotes, we've seen the points, we know where the holes are; we're ready to rock and roll. And to plot this graph.
 |