ShmoopTube
Where Monty Python meets your 10th grade teacher.
Search Thousands of Shmoop Videos
Data Representation Videos 15 videos
According to the data, the most sharks were recorded on:
According to the information in Table 1, what was the wind direction and wind speed during the feeding event that included the largest whale?
Based on Table 1, which wind direction had the highest total number of sharks?
ACT Aspire Science: Using Data to Read Rocks 0 Views
Share It!
Description:
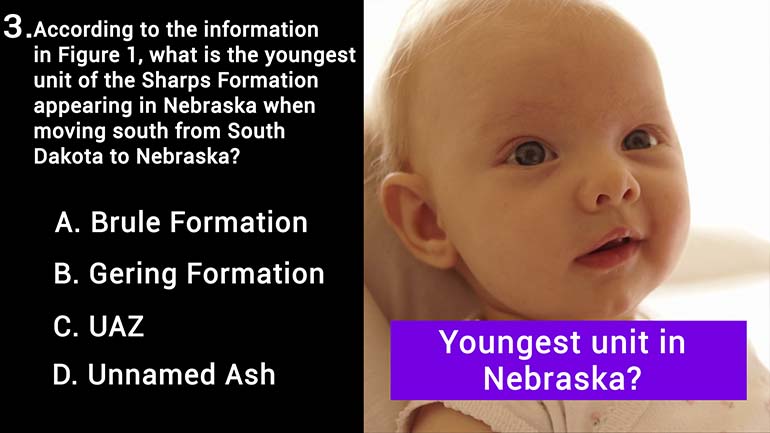
According to the data, in which NALMA does the Gering Formation occur?
Transcript
- 00:00
Yeah Oh okay Aspiring scientist Figure won This thing right
- 00:09
here shows the strata Graphic relationships of some of the
- 00:13
great Plains formations Strata graphic columns show older rocks the
- 00:18
bottom and younger rock units and toward the top right
- 00:21
there All right so here it is That's the data
Full Transcript
- 00:24
representing And when all the crap is that we're studying
- 00:27
Okay And they can kind of skim all this stuff
- 00:29
if you need Teo Here we go Last of this
- 00:36
section According to the data in which now Mama does
- 00:40
the Gehring formation occur And that's in a L M
- 00:43
Pei right there yet So we spell it Wei don't
- 00:48
even know what now Mo stands for here to answer
- 00:51
this question It might be the nerdy American lava Mama's
- 00:55
Association For all we know I want to join that
- 00:58
one Good All right well all that matters here is
- 01:00
that we see which now Alma aligns with the Gehring
- 01:04
formation Well tracing a horizontal line from the gear information
- 01:07
to see what corresponds to it We see the word
- 01:10
Eric Carrion Just a stone throw away in the now
- 01:14
McCollum Right Well the Whitney in dear Now my dozen
- 01:17
align with daring It's further down on the image And
- 01:20
Brule is a type of formation and shad Ron is
- 01:23
a structural feature So get rid of all those in
- 01:26
the right answer Here is a as in Eric Aryan
- 01:30
Yeah All right Good luck Mama Can I apply Where's
- 01:32
the How much of the entry fee
Related Videos
According to the data, the most sharks were recorded on:
According to the information in Table 1, what was the wind direction and wind speed during the feeding event that included the largest whale?
Based on Table 1, which wind direction had the highest total number of sharks?
According to the information in Figure 1, what is the maximum shark size for a wind speed of ~18 knots?
Based on the information in Figure 1, which of the following best describes the linear regression applied to the data for maximum shark size versus...
