ShmoopTube
Where Monty Python meets your 10th grade teacher.
Search Thousands of Shmoop Videos
Statistics and Probability Videos 134 videos
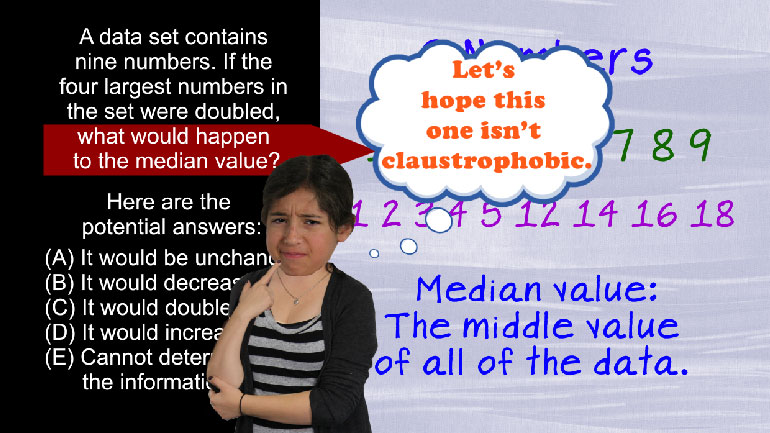
SAT Math: Statistics and Probability Drill 1, Problem 2. If the four largest numbers in the set were doubled, what would happen to the median...
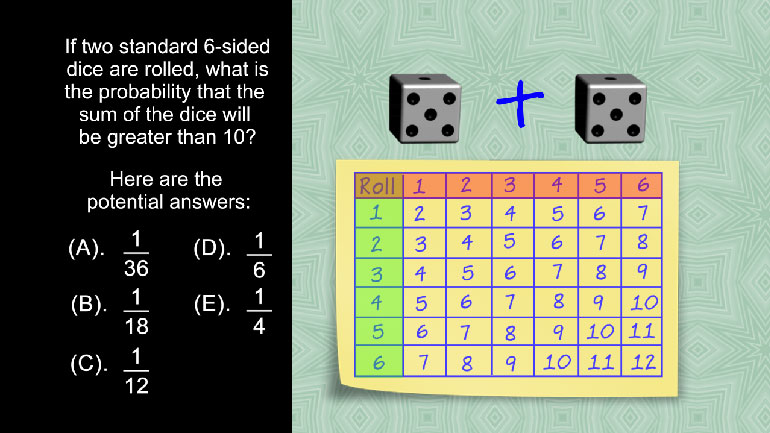
SAT Math 1.4 Statistics and Probability. If two standard 6-sided dice are rolled, what is the probability that the sum of the dice will be gre...
SAT Math 1.5 Statistics and Probability. If Silas draws one card, then places it in his pocket and draws another, what is the probability that...
CAHSEE Math 2.2 Statistics, Data, and Probability I 182 Views
Share It!
Description:
Statistics, Data, and Probability I: Drill Set 2, Problem 2. If this trend continues, what will be the price in week 7?
Transcript
- 00:04
Here's a boring, unshmoopy question you'll find on an exam somewhere in your life...
- 00:09
The table below shows the increase in price per share of a certain company's stock over
- 00:13
a period of 4 weeks. If this trend continues, what will be the price in week 7?
- 00:18
And here are the potential answers:
- 00:26
So ... what's this question really asking other than, "can you read a table?"
Full Transcript
- 00:31
Uh, no... this table. Right. Whenever we are asked to make predictions,
- 00:35
it is likely that we are being asked to find a PATTERN.
- 00:39
And in this case, they give us the pattern -- it's that the share price increased each week.
- 00:45
So our first thought, especially for you future stock brokers or investors out there,
- 00:49
should be "by how much did it increase?"
- 00:51
That is, the problem GIVES us that the stock
- 00:54
INCREASED. So let's first just figure out what it increased in week one.
- 01:01
We take $14.40 and subtract $12.15. We get two bucks and two bits.
- 01:07
Or... a fancy way of saying... two bucks and a quarter.
- 01:10
Let's do it for week 2 now and we get $16.65
- 01:14
minus $14.40 and yeah -- that's $2.25. Great.
- 01:18
Since the stock increased by the SAME amount, we know we have a CONSTANT trend.
- 01:24
If the stock had gone to any other number,
- 01:26
the answer would have been much harder to figure out.
- 01:28
But the question is asking us to carry this pattern out to the 7th iteration.
- 01:33
We are already at week 4 with a stock trading at $18.90 a share.
- 01:37
Now we get 3 more weeks of wealth creation.
- 01:40
We can spend some of that dough on Shmoop you know!
- 01:42
Always a wonderful gift for the little brother....
- 01:46
We can get there in 2 ways, the easiest of which is to just multiply $2.25 by 3...
- 01:52
...because there are 3 weeks to go from week 4 to week 7... and we get $6.75.
- 01:57
We'd add that to the last trade of $18.90 and get $25.65.
- 02:04
Yep, it's there on the answer choice menu as C.
- 02:07
If you are allergic to multiplication you could have just iterated 3 times and had:
- 02:11
Week 5... $18.90 + $2.25 Week 6... $21.15 + $2.25
- 02:17
And Week 7... $23.40 + $2.25 gets you $25.65
- 02:22
Either way, you arrive at the promised land of high investment returns, wealth, luxury...
- 02:27
...and the answer being C.
Related Videos
CAHSEE Math: Algebra and Functions Drill 5, Problem 3. Solve the equation.
Statistics, Data, and Probability I: Drill Set 3, Problem 4. How many different avatars can be created based on the given options?
Statistics, Data, and Probability II Drill 3 Problem 2. Which two sports together make up for the preferences of more than half of all those w...
Statistics, Data, and Probability II Drill 3 Problem 3. One hundred twenty of those who were asked preferred what sport?
