Histograms are another convenient way to display data. A histogram looks similar to a bar graph, but instead of plotting each individual data value on the x-axis (the horizontal one), a range of values is graphed. Histograms are useful when you have numerical data that varies quite a bit.
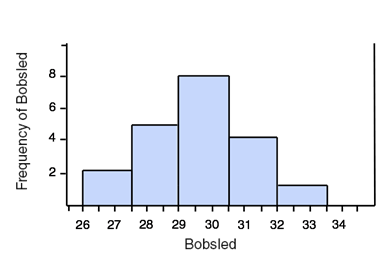
This is a histogram of the top 20 men's 2-man combined bobsled times for the 2010 Winter Olympics. Only the seconds are graphed since each time began with 3 minutes.

The times are marked on the x-axis, and the frequency (the number of teams who got each time) is graphed on the y-axis (the vertical one). By looking at the graph we can see that seven teams had a final time between 3:30 and 3:31 (3 minutes 31 seconds) and no teams had a time between 3:31 and 3:32.
This histogram has a "bin width" of 1 sec, meaning that the data is graphed in groups of 1 sec times. We could change the bin width to be larger or smaller. Here is the same data in a histogram with a bin width of 1.5 seconds:
The histogram doesn't display the individual times, nor are the times exact. However, it is a nice way to look at the trend of the data.
Example 1
Create a histogram displaying the top ten women's figure skating scores for the 2010 Winter Olympics
The x-axis needs to span from at least 171 to 229 in order to accommodate all of the data. |


Use the graphs below to answer questions #1-4
These histograms graph the amount of time (hours per day) that 46 middle school girls and 40 middle school boys in San Francisco spend on the website FaceSpace. 50 boys and 50 girls took the survey but 4 girls and 10 boys did not use these sites at all. Each is graphed with a bin width of 0.25 hours.

