Scatter plots are an awesome way to display two-variable data (that is, data with only two variables) and make predictions based on the data. These types of plots show individual data values, as opposed to histograms and box-and-whisker plots.
Here's a scatter plot of the amount of money Mateo earned each week working at his father's store:

The weeks are plotted on the x-axis, and the amount of money he earned for that week is plotted on the y-axis. In general, the independent variable (the variable that isn't influenced by anything) is on the x-axis, and the dependent variable (the one that is affected by the independent variable) is plotted on the y-axis.
Using this plot, we can see that in week 2 Mateo earned about $125, and in week 18 he earned about $165. More important is the trend of the data. For example, with this dataset, it is clear that Mateo is earning more each week. Maybe his father is giving him more hours per week or more responsibilities.
Correlation
With scatter plots we often talk about how the variables relate to each other. This is called correlation. There are three types of correlation: positive, negative, and none (no correlation).
- Positive Correlation: as one variable increases so does the other. Height and shoe size are an example; as one's height increases so does the shoe size.
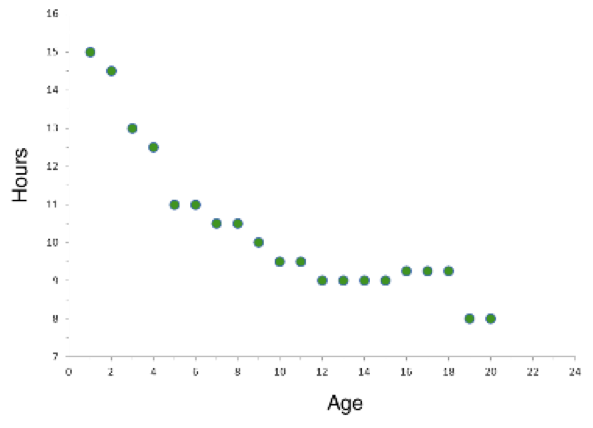
- Negative Correlation: as one variable increases, the other decreases. Time spent studying and time spent on video games are negatively correlated; as your time studying increases, time spent on video games decreases.
- No Correlation: there is no apparent relationship between the variables. Video game scores and shoe size appear to have no correlation; as one increases, the other one is not affected.
Mateo's scatter plot has a pretty strong positive correlation; as the weeks increase his paycheck does too.
Line of Best Fit
We use a "line of best fit" to make predictions based on past data. There are many complicated statistical formulas we could use to find this line, but for now, we will just estimate it. The line we draw through the points on the graph just needs to look like it fits the trend of the data. When drawing the line, you want to make sure that the line fits with most of the data. If there is a point that is much higher or lower (an outlier), it shouldn't be on the line.

Using this line, we can predict how much money Mateo will earn in his 20th week of work (assuming he continues this pattern).

Based on this line, Mateo will earn approximately $157 in week 20.
Here's another type of graph involving a bell curve