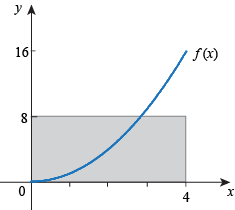
We're looking at c = 2 and f(c) = f(2) = 4. We want this point to be in the center of the window, so start by graphing f with 0 ≤ x ≤ 4
0 ≤ y ≤ 8. We see this: 
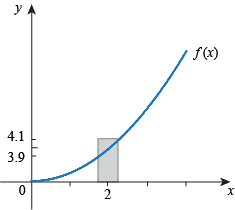
We want to have f(x) within 0.1 of f(c). Therefore we want to have f(x) within 0.1 of 4, or 3.9 ≤ f(x) ≤ 4.1.
Change the values of y in the calculator window accordingly, to make this picture: 
Yes, it looks crazy. That means we'll need to restrict x a lot. Start with letting x only move 0.1 away from 2, so 1.9 ≤ x ≤ 2.1. It won't quite work. Since we don't have a picture yet, try some other numbers. Having 1.95 ≤ x ≤ 2.05 doesn't work, and neither does 1.97 ≤ x ≤ 2.03. However, 1.98 ≤ x ≤ 2.02 does work, as does 1.99 ≤ x ≤ 2.01. Our final answer could be either of these. We could say "restrict x to within 0.02 of 2" or "restrict x to within 0.01 of 2," and either of these answers would be right. There are other right answers, also. As long as the point (c, f(c)) is in the center of the graph, the y values are what we want, and the graph shows a curve exiting on the sides of the graph (meaning that we can see what f(x) is doing for all values of x in the window), we have a picture and we've restricted x appropriately. |