Okay. Time to bust down some rational functions and graph them.
For rational functions, the graph can be divided into "sections". Each section of the graph is usually defined by their asymptotes. Once we know how they behave there, getting the rest of the graph together is as simple as plotting a few extra points. That makes a lot of sense. It should, given how rational these functions are.
Sample Problem
Sketch a rough graph of  .
.
Our first rational function to graph. Let's do it right, by starting with the asymptotes. The degrees of the two polynomials are equal, so we have a horizontal asymptote at y = 1. Let's factor to find any vertical ones, or holes.


A hole at x = 1? Hah, missed us. Not that it was trying that hard to get us. We can also confirm that there's a vertical asymptote at x = 4. Maybe it was out to get us? Or maybe we're just being paranoid.
That's all of the asymptote stuff we can find. Next let's find the x- and y-intercepts.

To find the x-intercept, we set the whole equation equal to 0 and solve for x. That sounds pretty awful for us, because we have x in both our numerator and denominator. But salvation is at hand, or at least a trick for making this easier.
y can only equal zero when the numerator is zero. That means we can ignore the denominator when finding the x-intercept.
0 = x2 – 1
(x + 1)(x – 1) = 0
x = -1 and 1
So, we have y = 0 at the points x = -1 and x = 1. We're almost ready to sketch this out. We have plenty of points to the left of our vertical intercept at x = 4, so we want a few to the right. Then we can…wait a second.
x = 1! We have a hole at x = 1. y can't equal zero there, because the function is undefined there; that's what a discontinuity is. We almost fell for you, x = 1, almost.
We do want those points we were talking about, though. Let's go for x = 5 and 6:


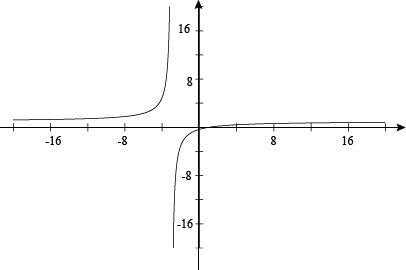
Now let's take all that we've learned about this graph and put it on paper. Or your screen, in this case.

The horizontal asymptotes tell us how the graph behaves at very small or very large numbers. In our case, they approach y = 1. The x- and y-intercepts showed us that the graph approached it from below the line; it would dive sharply downwards at the vertical asymptote. Our other two points gave us the shape of the graph on the other side.
And, of course, we can't forget the hole at x = 1. No, we won't forget you, you sneak.
Our general plan of attack when graphing is:
• Find all of the horizontal, vertical, and slant asymptotes.
• Check for holes, and remembering to graph them. Failure will result in falling in a hole.
• Find the x- and y-intercepts. Just use the numerator when working on the x-intercepts.
• Decide if you need more points to see how the graph is behaving in spots. When in doubt, grab more points.
• Sketch the graph out. We don't need to be exact, just get the general movement correct.
And with that, we are done. Smell ya later, Shmoopers.
Oh yeah, the cookie recipe. Here you go. Now we'll smell ya later. Especially if you've been baking cookies. Don't judge us.
 .
.


 .
.


 .
.


 .
.
 .
.
 .
.
 .
.
 .
.