Given the graph of y=∛x below, evaluate .
Hint
Examine the graph from the left and the right at x = 0.
Answer
The limit is 0 as x approaches 0.
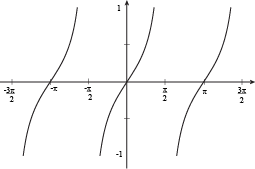
Given the graph of y = tan(x) below, evaluate .
What is the graph's behavior at ?
The limit Does Not Exist
Given the graph of y = f(x) below, evaluate .
Limits aren't defined if the graph approaches two different values from left to right.
The limit Does Not Exist at x = 0.
Use the graph of the function f(x) to evaluate the given limits.
a)
b)
c)
This whole left vs. right thing is becoming a little repetitive, but it keeps being true.
For the function below, which values of x have limits that do not exist?
For the full limit to not exist, the limit from the left has to be unequal to the limit from the right.
The limit DNE at x = a.
You've been inactive for a while, logging you out in a few seconds...