ShmoopTube
Where Monty Python meets your 10th grade teacher.
Search Thousands of Shmoop Videos
Playlist ACT® Science Data Representation 25 videos
ACT Science: Data Representation Passage Drill 1, Problem 1. What do the statistics in Figure 1 suggest?
ACT Science: Data Representation Passage Drill 1, Problem 2. Which of the following is a variable in Figure 1, but not in Figure 2?
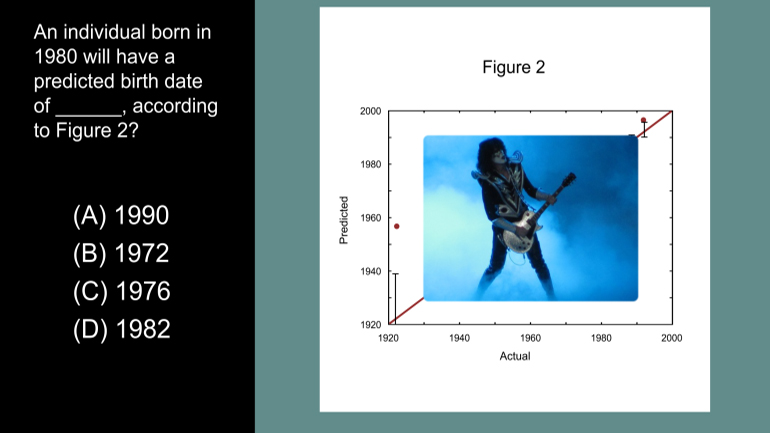
ACT Science Data Representation Passage: Drill 3, Problem 5. According to Figure 2, what birth date will be predicted for an individual actual...
Giants' Players Weights in 2009 214 Views
Share It!
Description:
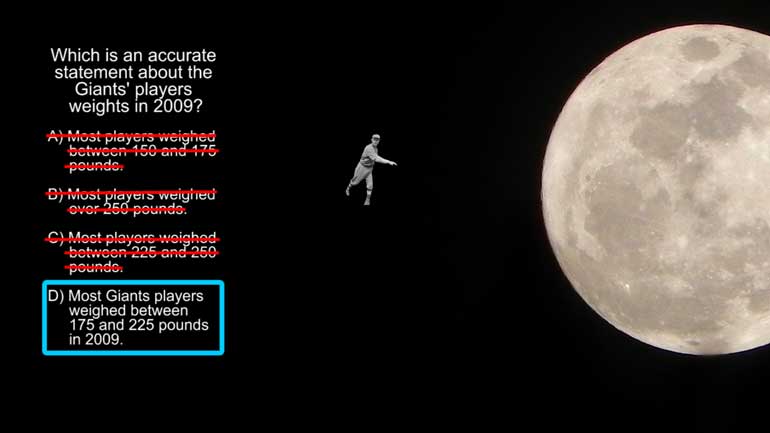
ACT Science: Data Representation Passage Drill 1, Problem 8. Which is an accurate statement about the Giants' players weights in 2009?
Transcript
- 00:03
Here's your shmoop du jour, brought to you by the kindly, loving people of Lilliput.
- 00:09
Which is an accurate statement about the Giants' players weights in 2009?
- 00:15
Here are the potential answers...
- 00:21
This question is asking us about the Giant's
- 00:23
players weight...information we can find in figure 2.
Full Transcript
- 00:27
More specifically..on the y-axis of the graph.
- 00:30
Looking at the first statement, most players weighed between 150 and 175 pounds.
- 00:35
Well, all the red circles that represent each of the players fall between 190 and 200...
- 00:40
...not really between 150 and 175.
- 00:42
Which means we can try to find the given interval that encompasses 190 to 200.
- 00:47
Only option D gives us the proper interval.
- 00:50
175 to 225 covers 190 and 200.
- 00:54
Which makes sense right? It's hard to run around the bases for an athlete who's so skinny
- 00:57
a gust of wind can blow him over or, conversely, he's so heavy that running halfway to first
- 01:02
feels like running halfway to the moon...So the answer is (D).
Related Videos
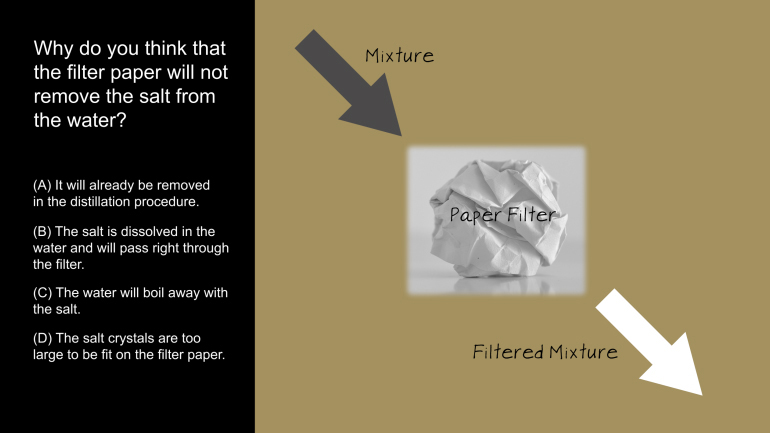
ACT Science: Research Summary Passage Drill 2, Problem 1. Why do you think that the filter paper will not remove the salt from the water?
ACT Science: Conflicting Viewpoint Passage Drill 1, Problem 1. What statement would both scientists agree upon?
ACT Science: Data Representation Passage Drill 1, Problem 1. What do the statistics in Figure 1 suggest?
ACT Science: Data Representation Passage Drill 1, Problem 2. Which of the following is a variable in Figure 1, but not in Figure 2?
ACT Science Data Representation Passage: Drill 3, Problem 5. According to Figure 2, what birth date will be predicted for an individual actual...


