ShmoopTube
Where Monty Python meets your 10th grade teacher.
Search Thousands of Shmoop Videos
Playlist ACT® Science Data Representation 25 videos
ACT Science: Data Representation Passage Drill 1, Problem 1. What do the statistics in Figure 1 suggest?
ACT Science: Data Representation Passage Drill 1, Problem 2. Which of the following is a variable in Figure 1, but not in Figure 2?
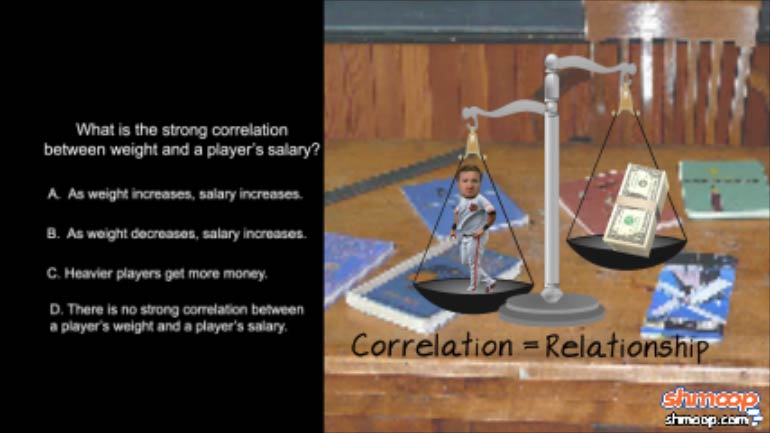
ACT Science: Data Representation Passage Drill 1, Problem 3. What is the strong correlation between weight and a player's salary?
ACT Science 2.5 Data Representation Passage 203 Views
Share It!
Description:
ACT Science: Data Representation Passage Drill 2, Problem 5. What would the fold effect be?
Transcript
- 00:04
Here's your shmoop du jour, brought to you by...well, nothing.
- 00:21
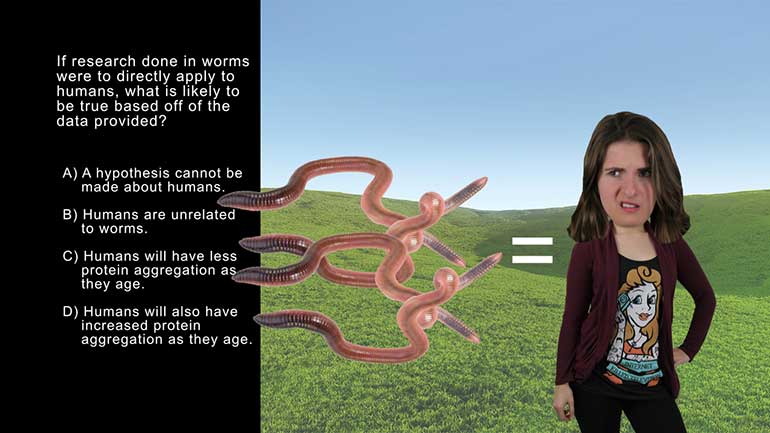
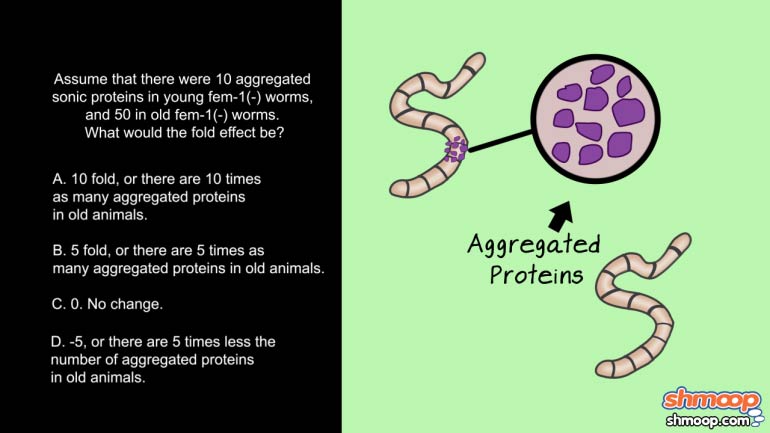
Assume that there were 10 aggregated sonic proteins in young fem-1(-) worms, and 50 in
- 00:27
old fem-1(-) worms. What would the fold effect be?
- 00:34
And here are the potential answers...
- 00:38
Alright, this doesn't even requires us to look at any graphs..
Full Transcript
- 00:42
It's a straightforward question.
- 00:45
If there are 10 aggregated proteins in the young worms,
- 00:48
and 50 in the old worms..
- 00:50
we have a multiple of 5 times as many aggregate proteins in the old animals.
- 00:55
In worm speak...
- 00:58
...the fold effect would be 5 fold. Answer's B.
Related Videos
ACT Science: Data Representation Passage Drill 1, Problem 1. What do the statistics in Figure 1 suggest?
ACT Science: Data Representation Passage Drill 1, Problem 2. Which of the following is a variable in Figure 1, but not in Figure 2?
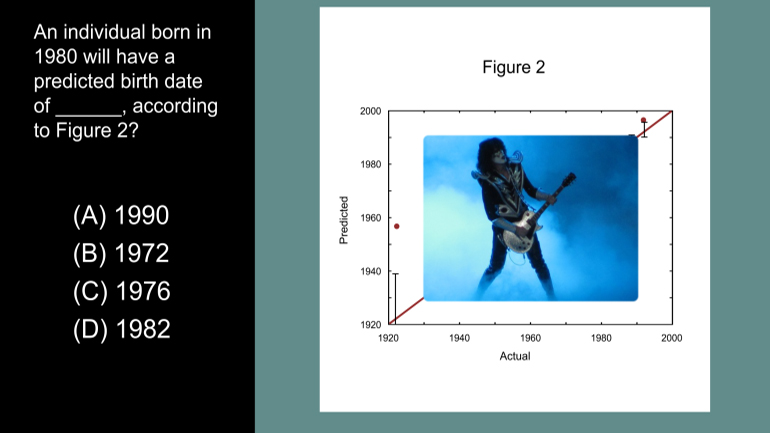
ACT Science Data Representation Passage: Drill 3, Problem 5. According to Figure 2, what birth date will be predicted for an individual actual...
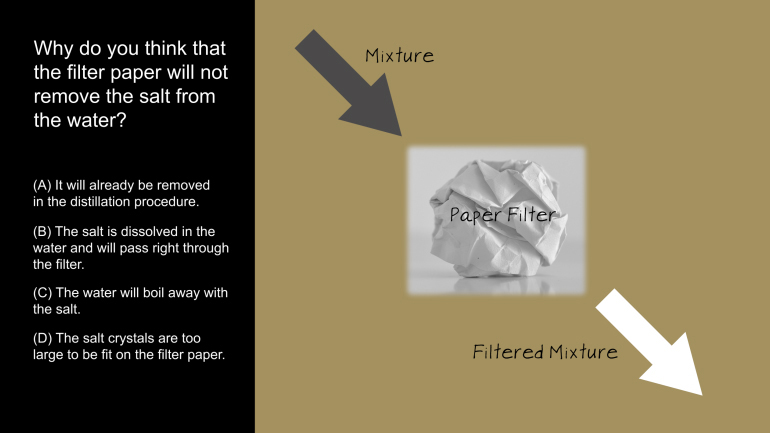
ACT Science: Research Summary Passage Drill 2, Problem 1. Why do you think that the filter paper will not remove the salt from the water?
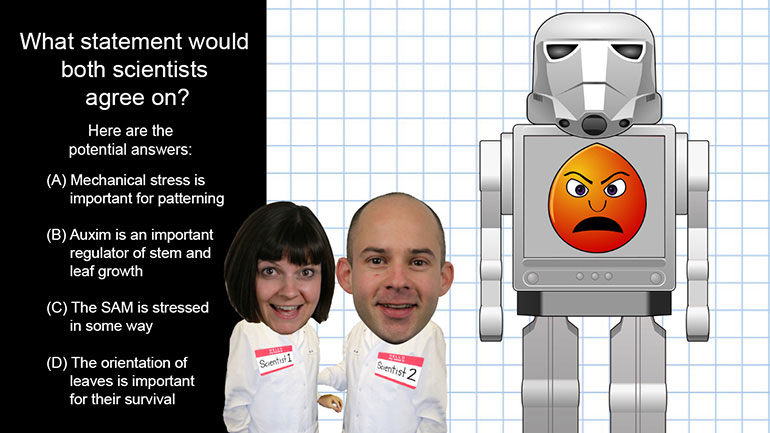
ACT Science: Conflicting Viewpoint Passage Drill 1, Problem 1. What statement would both scientists agree upon?


