ShmoopTube
Where Monty Python meets your 10th grade teacher.
Search Thousands of Shmoop Videos
Statistics, Data, and Probability II Videos 30 videos
Statistics, Data, and Probability II Drill 3 Problem 2. Which two sports together make up for the preferences of more than half of all those w...
Statistics, Data, and Probability II Drill 3 Problem 3. One hundred twenty of those who were asked preferred what sport?
CAHSEE Math Statistics, Data, and Probability II: Drill 1 Problem 1. Which of the following tables best represents the relationship between the val...
CAHSEE Math 4.3 Statistics, Data, and Probability II 188 Views
Share It!
Description:
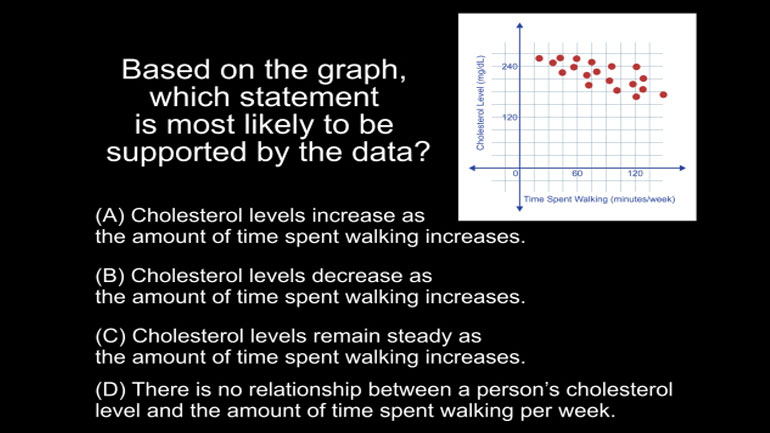
Statistics, Data, and Probability II Drill 4 Problem 3. Based on this graph, a person who walks about 2.5 hours per week can expect to have a cholesterol level of what?
Transcript
- 00:03
And here's another shmoopy question for ya.
- 00:06
The following graph shows points representing the relationship between the amount of time
- 00:09
spent walking per week and cholesterol levels of various people.
- 00:12
The people who don’t walk at all… are on an entirely different, much more depressing graph.
- 00:17
Based on this graph, a person who walks about 2.5 hours per week can expect
Full Transcript
- 00:21
to have a cholesterol level of… what?
- 00:25
And here are the potential answers...
- 00:33
Scatter plot question. These are all about just making educated guesses.
- 00:37
Emphasis on… educated.
- 00:40
First let’s find the key points – the question asks about what happens after 2 and
- 00:44
a half hours or 150 minutes of walking…
- 00:47
…so we get a line starting here… as each block is 15 minutes.
- 00:52
If we draw the line upwards, we cross dots around here…
- 00:55
…so if we draw a horizontal line back to the y-axis…
- 00:58
…we get to a spot about half way between 120 and 240
- 01:02
or at about the 180 milligrams per deciliter line.
- 01:05
So the answer is B.
- 01:07
As in… “Butter pecan.”
Related Videos
CAHSEE Math: Algebra and Functions Drill 5, Problem 3. Solve the equation.
Statistics, Data, and Probability I: Drill Set 3, Problem 4. How many different avatars can be created based on the given options?
Statistics, Data, and Probability II Drill 3 Problem 2. Which two sports together make up for the preferences of more than half of all those w...
Statistics, Data, and Probability II Drill 3 Problem 3. One hundred twenty of those who were asked preferred what sport?


