ShmoopTube
Where Monty Python meets your 10th grade teacher.
Search Thousands of Shmoop Videos
Statistics, Data, and Probability II Videos 30 videos
CAHSEE Math Statistics, Data, and Probability II: Drill 1 Problem 1. Which of the following tables best represents the relationship between the val...
Statistics, Data, and Probability II Drill 1, Problem 2. Based on the chart, which of the following statements is true?
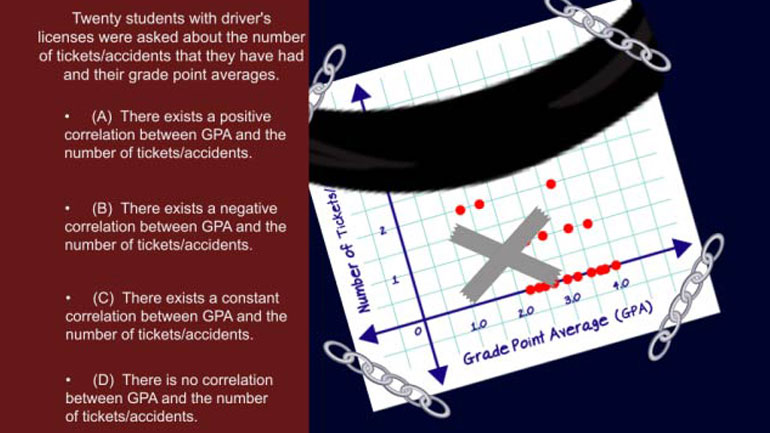
CAHSEE Math Statistics, Data, and Probability II: Drill Set 1, Problem 3. Based on the following, which of the following statements is true?
CAHSEE Math 2.5 Statistics, Data, and Probability II 169 Views
Share It!
Description:
Statistics, Data, and Probability II: Drill Set 2, Problem 5. How many models are rated for more than 35 miles per gallon (mpg)?
Transcript
- 00:03
Here’s an unshmoopy question that may haunt you on some future exam…
- 00:07
The following graph shows how many different vehicle models of an automaker fall into the
- 00:11
different categories for fuel efficiency.
- 00:14
How many models are rated for more than 35 miles per gallon?
- 00:18
And here are the potential answers...
Full Transcript
- 00:24
Can we read a table?
- 00:26
The question asks for MORE THAN 35 miles per gallon – this is like Prius territory plus
- 00:32
so we ignore the 31-35 bar and everything to its left.
- 00:37
The “more than” group is the last 2 bars. The 36-40 bar is 5 models if you draw a straight
- 00:45
line across the top to the y axis.
- 00:49
Do the same on the 41-45 group and it looks like 2 models – so 5 plus 2 is 7.
- 00:56
And our answer is B.
Related Videos
CAHSEE Math: Algebra and Functions Drill 5, Problem 3. Solve the equation.
Statistics, Data, and Probability I: Drill Set 3, Problem 4. How many different avatars can be created based on the given options?
Statistics, Data, and Probability II Drill 3 Problem 2. Which two sports together make up for the preferences of more than half of all those w...
Statistics, Data, and Probability II Drill 3 Problem 3. One hundred twenty of those who were asked preferred what sport?


