The best way to graph polar functions is by using a graphing calculator or a computer program. We can wave our hands and pull a rabbit out of a hat. That's because there aren't as many rules about graphing polar functions. Those few rules that we do have can be much more complex.
With a rectangular function
y = f (x)
there are certain rules about how the function stretches or translates if we look at variations such as:
cf (x)
c + f (x)
f (cx)
f (c + x)
where c is a constant.
We have rules like this when dealing with polar functions too, but not as many.
- The graph of r = cf (θ) will be the same shape as the graph of r = f(θ), but stretched away from or squished toward the origin by a factor of c.
- The graph of r = f (θ – c) is the same as the graph of r = f(θ), but rotated by an angle of c.
As far as nice rules for graphing go, that's all we get.
- There's no nice rule that tells us how the function r = f(cθ) looks.
- There's no nice rule that tells us how the function r = c + f (θ) looks.
We can verify that the function r = f (cθ) is weird by trying different values in the graphing calculator.
The function r = c + f(θ) is also weird. Adding a constant can change whether your r values are positive or negative, which can totally change the shape of the graph. It may also change the bounds we need for θ if we want to find the whole graph.


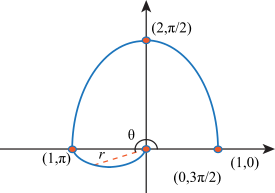
 , the value of r will move from 2 to 1.
 to θ = π, the value of r will move from 1 to 0.
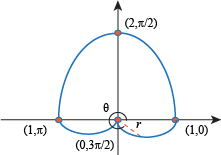
 , the value of r will move from 0 to 1.


 for 0 ≤ θ ≤ 4π.


 , the value of r will move from 1 to 0.