First we need to find the dots, because these dots will tell us the intervals we need to work with. Actually, for this part we only need to
find the x-values of the critical points and possible inflection points. The derivative is f '(x) = -12x2 + 3 which is zero when 
We have critical points at  . . The second derivative is f "(x) = -24x which is 0 when x = 0, so this is a possible inflection point. Now that we've found the CPs and possible IPs, we make a numberline. The CPs and possible IPs divide the numberline up into intervals. 
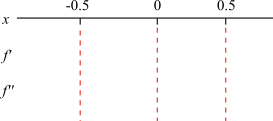
We need to know the signs of f ' and f " on each of these intervals. We draw dashed lines so we can keep the intervals straight: 
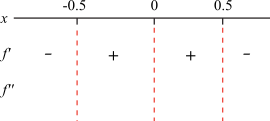
The derivative is positive when 12x2 < 3 which occurs when 
The derivative is negative otherwise. Fill this in on the numberline: 
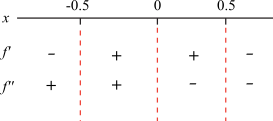
The second derivative is negative when x is positive, and positive when x is negative: 
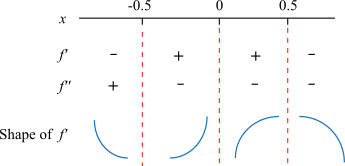
Now we can see what shape f should have on each interval: 
The numberlines in the graphing exercises will also include a numberline for the sign of the function f, because seeing where f is positive and negative is useful for drawing the graph correctly. However, you don't need to know the sign of f to determine the shape of f. |