ShmoopTube
Where Monty Python meets your 10th grade teacher.
Search Thousands of Shmoop Videos
Math Videos 206 videos
Statistics, Data, and Probability I: Drill Set 2, Problem 2. If this trend continues, what will be the price in week 7?
Statistics, Data, and Probability I: Drill Set 2, Problem 3. Which of the following statements is true?
Statistics, Data, and Probability I: Drill Set 2, Problem 4. Which of the following statements is true?
CAHSEE Math 4.5 Algebra and Functions 239 Views
Share It!
Description:
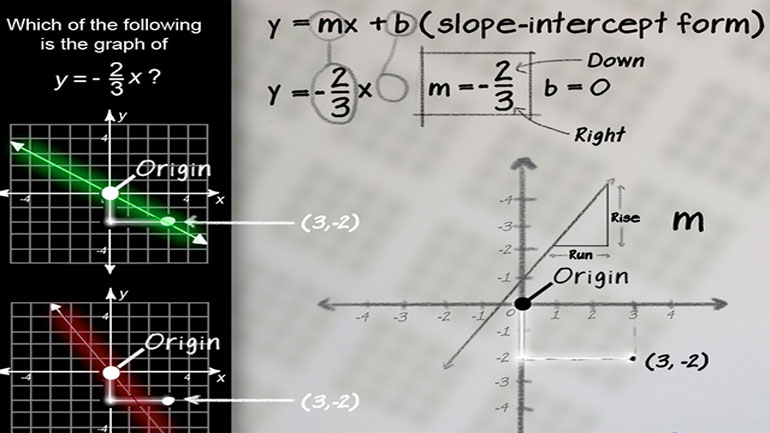
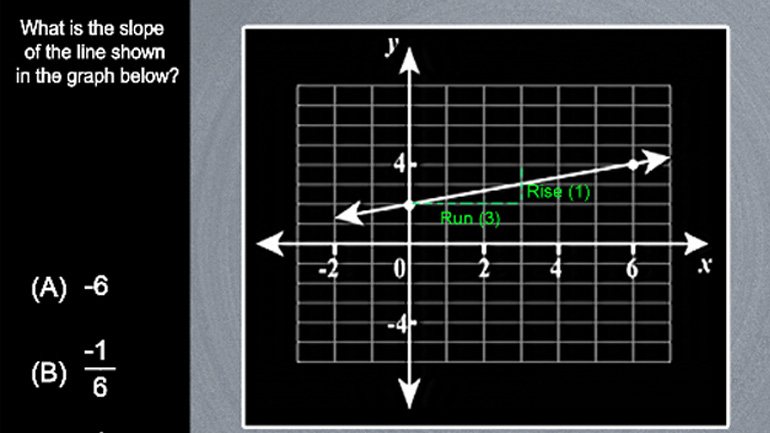
Algebra and Functions: Drill Set 4, Problem 5. What is the slope of the line in the graph?
Transcript
- 00:03
And here's your shmoopy question of the day.
- 00:06
What is the slope of the line shown in the graph below?
- 00:09
Here are the potential answers...
- 00:12
Hit pause, try it yourself.
- 00:17
Do we remember that whole y = mx plus b thing? That m is slope and slope is rise over run?
Full Transcript
- 00:23
Well, let's hope so.
- 00:25
There's a pretty easy brute force way
- 00:26
to figure this one out -- a new process called counting.
- 00:30
Start here and count over as many squares until the line intersects cleanly a solid
- 00:35
line above it.
- 00:36
And we go 3 over to the right -- and then we can rise 1.
- 00:40
Note that the slope goes from left to right in an upward or positive direction --
- 00:45
so the slope is POSITIVE.
- 00:47
Note also that slopes can be zero -- if they flat. Rise to run then is just 0 over
- 00:53
... well anything, really. 0 over anything is 0.
- 00:55
What if the line is vertical?
- 00:57
Then you have rise of... whatever... over run of... 0.
- 01:01
Can we ever divide by 0?
- 01:03
Well, not if we don't want to get an eraser to the head from our math teacher. No, we can't.
- 01:07
Anyway, in this case the slope, or rise over run, is 1 over 3...
- 01:12
...and it's answer C. Done.
- 01:14
It's okay to be excited that we figured this thing out. Go ahead... give a little yodel.
Related Videos
CAHSEE Math: Algebra and Functions Drill 5, Problem 3. Solve the equation.
The video will show you how to plot points in 3D using the axes of the 3D coordinate system. Make sure you're wearing your special glasses for this...
When graphing inequalities, you graph the line, shade the corresponding side, and plug in the point. The end!
One formula to rule them all, one formula to find them. One formula to bring them all, and in the darkness bind them. Or something like that. I...


